Carnival Co. & plc (NYSE: CCL) is the world's largest cruise line operator and leisure travel company, with an estimated 47% market share. The consumer discretionary sector giant was one of the hardest hit during the pandemic and has been trying to recover since. While most casual investors and consumers may believe Carnival offers budget-friendly namesake cruises under it Carnival Cruise Line brand, it actually operates under multiple brands catering to a wide range of budgets, vacation styles and demographics.
Rival cruise ship operator Royal Caribbean Cruises Ltd. (NYSE: RCL) has seen its share recover to pre-pandemic levels onto all-time highs. Norwegian Cruise Line Holdings Ltd. (NLCH) shares are a fraction of its pre-COVID levels. Carnival remains the laggard as it’s still trying to return to profitability.
Carnival’s Portfolio of Brands
Carnival operates 87 ships under 9 brands, serving over 13 million passengers annually. Its namesake, Carnival Cruise Lines, is the biggest brand, with 22 ships operating 1,500 trips annually. Its largest ship, Panorama, holds 4,008 guests. Its Seaborn cruise line provides an ultra-luxury experience for affluent cruisers. Princess Cruise Lines is an upscale premium brand catering to experienced cruisers with elegant dining options.
Cunard and Holland America appeal to mature travelers and culture enthusiasts. Its Costa Cruises is a popular European line. Aida Cruises operates in Germany, and P&P Cruises serves mostly Australia and the UK. Check out the sector heatmap on MarketBeat.
Still Digging Out of the Hole.
Carnival reported a fiscal Q1 2024 EPS loss of 14 cents, beating consensus analyst estimates for a loss of 18 cents by 4 cents. Adjusted net loss was $180 million. Adjusted EBITDA was $871 million. Gross margins doubled in 2023, and net yields exceeded 2023 levels by more than 17%. Revenues rose 22% YoY to a record $5.41 billion versus $5.42 billion consensus estimates.
Staggering Metrics being Hit
Carnival experienced an early start to its wave season with booking. Bookings rose to all-time highs with considerably higher prices YoY. Strength was robust across all its brands with the NAA segment considerably higher compared to Europe YoY. Total customer deposits hit a record $7 billion, surpassing the previous record by $1.3 billion. Carnival ordered its first new builds in 5 years to be delivered in 2027 and 2028. The booked position for the rest of the year is the best on record both in terms of pricing and occupancy, which is "considerably higher" than 2023.
Return to Profitability in 2024 Estimates
Carnival expected Q2 2024 EPS for a loss of 3 cents, matching consensus estimates. Adjusted EBITDA is expected to rise more than 50% YoY to approximately $1.05 billion, with net yields in CC up nearly 10.5% YoY, including the unfavorable impact of the Red Sea rerouting of 0.5 percentage points.
Carnival raises full-year 2024 EPS to 93 cents, short of $1.00 consensus analyst estimates. The company expects net yields to rise to 9.5% in constant currency (CC) YoY. Adjusted cruise costs, excluding fuel, are expected to improve by $35 million over December guidance. Adjusted EBITDA is expected to grow 30% YoY to around $5.63 billion despite Red Sea rerouting of nearly $130 million or 9 cents adjusted EPS impact.
Baltimore Key Bridge
The Francis Scott Key Bridge collapse in Baltimore, MD, caused Carnival to change its homeport temporarily. This could cause up to a $10 million impact on adjusted EBITDA and adjusted net income for the full year 2024.
CEO Comments
Carnival CEO Josh Weinstein commented, “Our improving operational performance coupled with excess liquidity and the lowest order book in decades leaves us well positioned to continue to opportunistically manage down debt and interest expense while reducing the complexity of our capital structure.”
Weinstein continued, “This is very much aligned with our return to investment grade credit over time, and our treasury team has been quick to capitalize on this trajectory with an ongoing stream of well-executed transactions to strengthen our balance sheet.” Weinstein noted that the vast majority of the year’s business is already booked on track for delivering record revenues and EBITDA.
Carnival analyst ratings and price targets are at MarketBeat. Carnival’s peers and competitor stocks can be found with the MarketBeat stock screener.
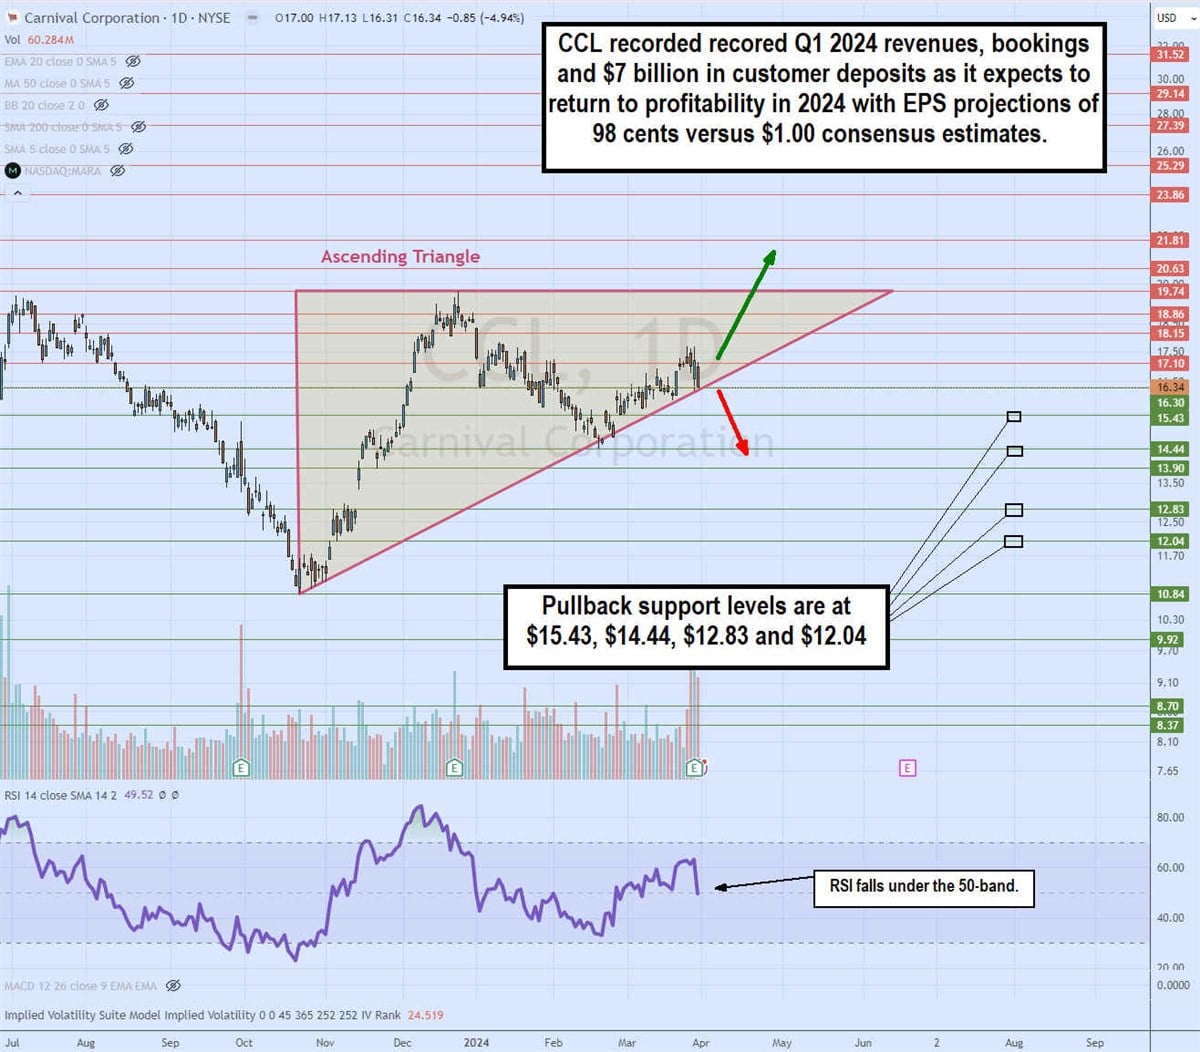
Daily Ascending Triangle Pattern
The daily candlestick chart for CCL illustrates a daily ascending triangle pattern. The ascending lower trendline formed at a low of $10.84 on Oct. 20, 2024. CCL made higher lows, rising towards the flat-top upper trendline resistance at $19.74. Shares are poised to either break out through the $19.74 resistance into the $20s or break down under the ascending trendline support at $16.30.
The daily relative strength index (RSI) is starting to fall under the 50-band. Pullback support levels are at $15.43, $14.44, $12.83 and $12.04.


