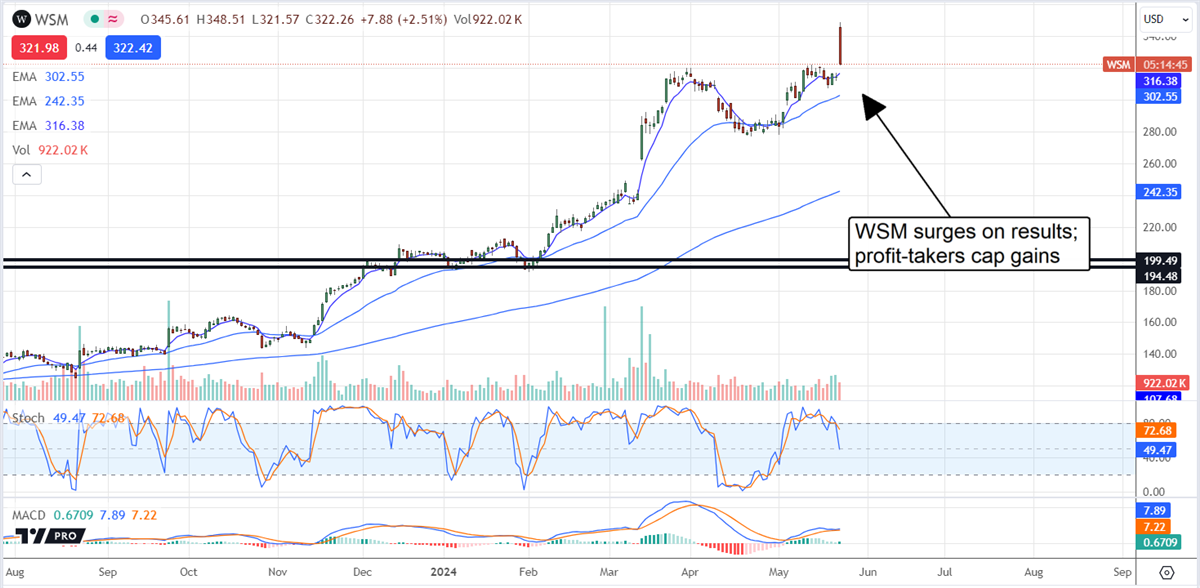
Williams-Sonoma’s (NYSE: WSM) stock price is heading to $500 for three reasons: its market, operations, and technical outlook. All else aside, the technical action has been robust for the last year and shows little signs of slowing. The latest earnings report has the market up to a new high, breaking out of a consolidation range and heading higher, driven by sustainable operations, margin strength, cash flow, and capital return. Because the rally preceding the breakout is worth nearly $200 or 200%, it could advance by those figures again, putting the minimum target at $500 or more than 50% from the $330 level.
Williams-Sonoma had a Cosy Quarter, Widening Margin and Outperforming
Williams-Sonoma’s Q1 results are mixed, with revenue aligning with the consensus and earnings outperforming. The top line contracted by 5.7%, which is not good, but the contraction was expected due to post-COVID normalization and the impact of high interest rates and inflation on retail.
However, results are mixed segmentally, highlighting the company’s diversification and resilience in core markets. Pottery Barn was the weakest link, with a contraction of 11%. West Elm also contracted by 4%, but the core Willams-Sonoma brand and Pottery Barn Kids grew. WSM grew by 0.9% and PBK by 2.8%, but the big news is the margin.
Williams-Sonoma’s earnings results have shown brand strength, pricing power, and consumer resilience for years, but the new data surpasses the high end of expectations. Even when adjusting for an out-of-quarter event, the margin widened at the gross and operating levels on favorable merchandise margin and supply chain efficiency. The GAAP EPS of $4.07 beat by $1.37, including the out-of-quarter addition; adjusted for it, EPS of $3.48 is $0.80 better than last year and nearly $0.80 above the consensus, leading the company to raise its guidance.
Williams-Sonoma reiterated its revenue guidance but raised the outlook for earnings. The company now expects an operating margin of nearly 18%, which is at the high end of its long-term goal. The news was well-received because it puts the consensus estimate reported by Marketbeat.com well below the new range and plays into the capital return outlook.
Williams-Sonoma is a Fortress That Pays you to Own it
Williams-Sonoma’s cash flow is robust and allows for solid capital returns. The Q1 results provided enough operating capital to pay dividends, repurchase shares, and build cash on the balance sheet. Cash is up roughly 6X compared to last year, with inventory down but only marginally compared to the cash build. Cash and inventory are now equal in size; the company is in lean shape and prepared to invest as it needs. Balance sheet highlights also include increased current and total assets, total liabilities down, no debt, and a 50% increase in equity.
The dividend is worth about 1.45% with shares at their new high, which is not a large payout but reliable and growing. The company is on track to equal Dividend Aristocrat quality within the next ten years and is increasing the payout at a substantially high 16% CAGR. Repurchases benefit shareholders, reducing the diluted count by a 2% average for the quarter, and are expected to continue through year-end.
Williams-Sonoma Hits New High on Margin Strength
Williams-Sonoma’s stock price surged more than 5% on the news and hit a new high. The bad news is that profit-taking gripped the market, causing it to sell off from the opening high. The move does not negate the power of the breakout, but sellers may cap gains in the near term. The critical support target is the previous all-time high. If that level holds, a rebound should form soon. If not, WSM stock could fall to $300 or lower before resuming the uptrend.