Congressional trading activity is important because Congress regularly outperforms the broad market. Rules and regulations aside, these people have a deeper knowledge and understanding of how legislation and international relations impact a business, as shown in their results. That’s why so many investors like to follow along with Congress. This is a look at the most actively bought and sold stocks by Congress this quarter. The results are interesting.
Applied Materials is the Most Bought Stock By Congress
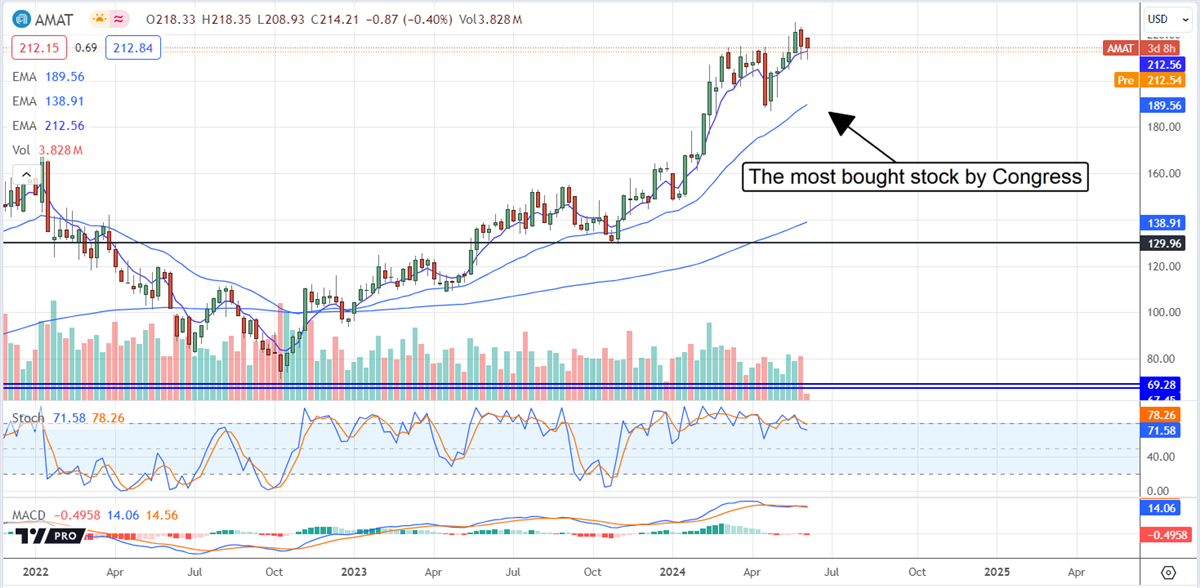
Applied Materials (NASDAQ: AMAT) is the most bought Stock by Congress, and this is saying something because it leads the #2 position Home Depot (NYSE: HD) by a wide margin. Three Congresspeople are in the mix, including John Boozman (R-AR) and Tommy Tuberville (R-AL). Both sides of the aisle made purchases totaling $123,500, a small amount but nearly 6X the amount spent on Home Depot.
Among the drivers for this trade are the results, which have outperformed expectations for the last year. The company is well-positioned as a manufacturer and purveyor of semiconductor manufacturing equipment, which is in demand because of the accelerating advancement of AI chips and billions in government spending focused on re-shoring the US semiconductor industry.
The Q1 results were solid, but the strength relative to consensus was expected due to the revision trend. This led the market to sell off but left the uptrend in stock prices intact. The move lower aligned the market with the consensus estimate, which rose nearly 8% since the release. The revisions lead the market to the high end of the analysts' range and imply another 10% upside for this Moderate Buy-rated stock.
Home Depot is Actively Bought This Year
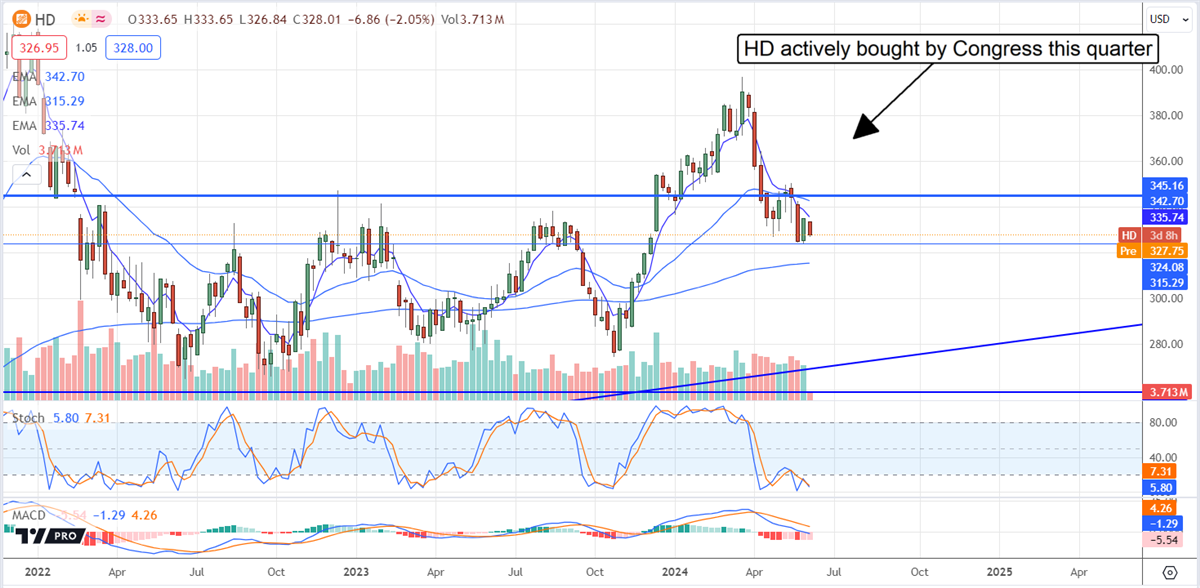
Home Depot is the 2nd most actively bought by Congress, with three Congresspeople making a single trade each. Buyers include Kevin Hearn (R-OK), Marjorie Taylor Greene (R-GA), and Lloyd Doggett, with trades estimated at $24,000. Drivers for this trade include the company’s market-leading position, professional home improvement market exposure, capital returns, and an upcoming economic pivot driven by the FOMC. The FOMC is expected to slash interest rates later this year and unstick a virtually frozen housing market.
MarketBeat tracks 28 analysts with ratings on HD stock. They rate the stock at Moderate Buy and are leading the market to a rebound, if not a new high. The post-release activity includes numerous price target reductions that range around and align with the current consensus of $377, a 15% upside from recent price action.
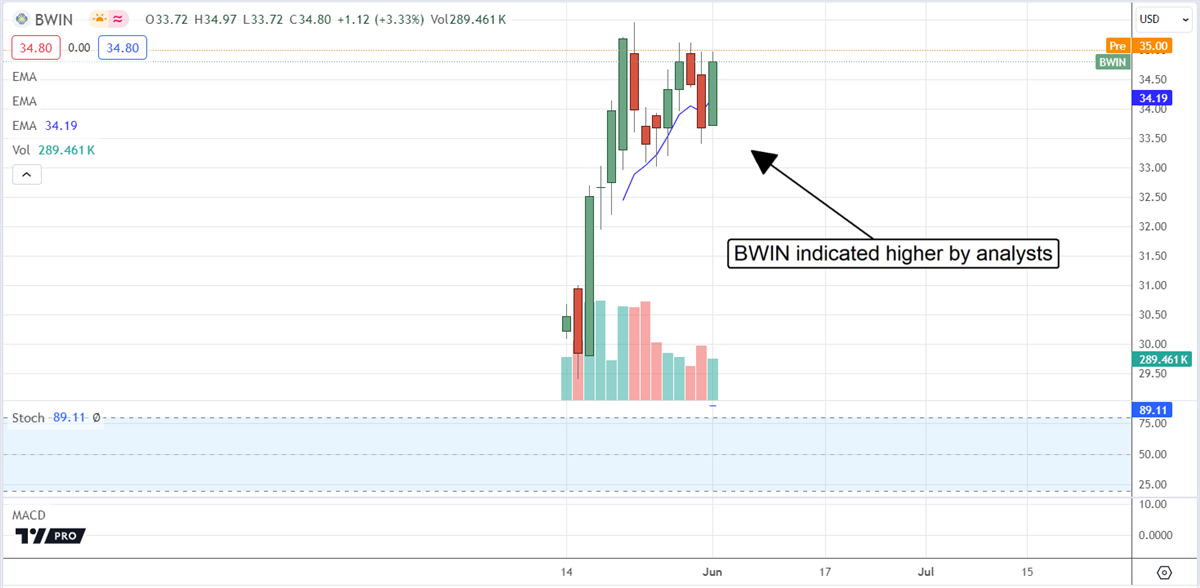
The Most Sold Stock by Congress is The Baldwin Group
The Baldwin Group (NASDAQ: BWIN) is the most sold stock by Congress, and its details are telling. The three sales are made by a single member, C.Scott Franklin (R-FL), and amount to nearly $3.8 million, making it the most actively traded stock by buyers or sellers. Coincidentally, the sales come from a Florida representative ahead of what is forecast to be a busy hurricane season, but there is probably no connection there. The analysts tracked by MarketBeat rate The Baldwin Group at Strong Buy with the potential for a 30% upside.
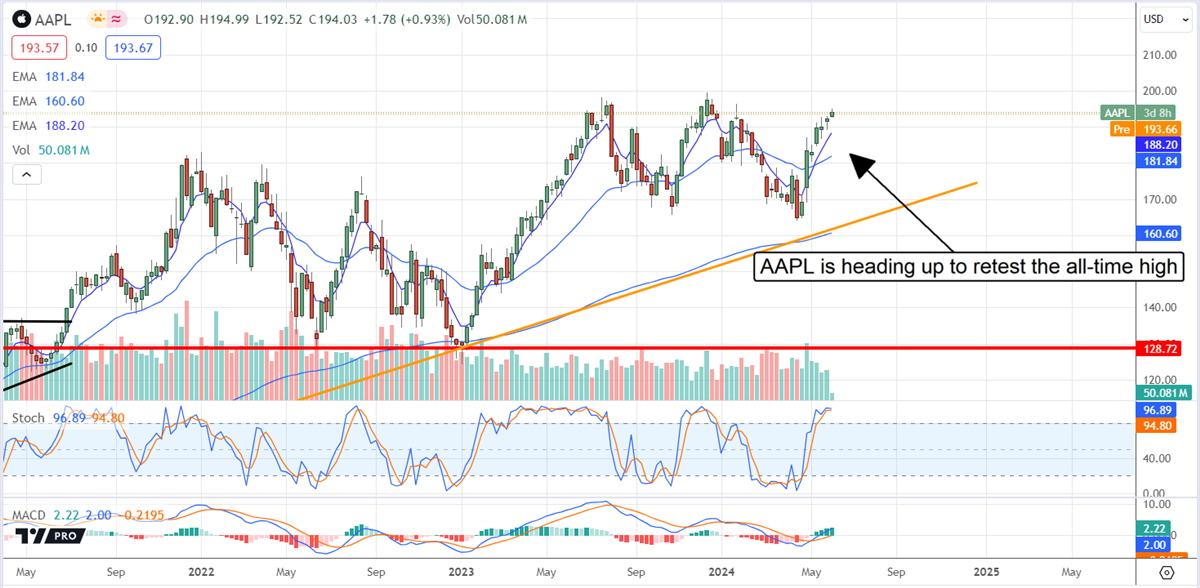
Apple Gets The Stink-Eye From Congress
Trading in Apple (NASDAQ: AAPL) was active, with six members making eight trades totaling $137,500. Trades were made by members of both parties, including Josh Gottheim (D-NJ) and Tommy Tuberville (R-AL). The drivers for this trade could be the company’s lagging position in AI and weakness/headwinds in China. Their activity coincides with a top for the market set earlier this year, but it looks like it is about to get blown off. Analysts have been lifting this stock's sentiment rating and price targets ahead of this month’s upcoming developer conference and product announcements. They see Apple moving up to and above $205 to set another new high before the end of the year.