
Newmont Co. (NYSE: NEM) is the world’s largest gold mining company. The company engages in the exploration, development, and production of not only gold but also copper, silvers, zinc, lead, lithium, coal, nickel, and aggregates. The company is also pursuing oil and gas development. Newmont is the world’s largest gold producer, as measured by prospects, assets, and people actively operating mines in nine countries. The diversity of its mined products allows for a cushion of safety even when gold prices sink.
Newmont operates in the basic materials sector and competes with miners like Barrick Gold Co. (NYSE: GOLD), Kinross Gold Co. (NYSE: KGC), and Rio Tinto Group (NYSE: RIO).
Newmont is a One-Stop Shop for Precious Metals
Newmont has a diverse portfolio of assets. Its primary assets are its Tier-1 gold mines, which are considered the richest in the industry in terms of size, production costs, and reserves. The company continues to invest in exploration to discover new gold deposits and expand its resource base. The company also mines copper, silver, lead, and zinc.
Rising Gold and Precious Metals Prices Mean More Profits
Newmont reported the average realized gold price in Q2 2024 was $2,347 per troy ounce. Gold hit $2,486 on August 2, 2024. The company realized an average copper price of $4.47, silver of $26.20, lead at $1.05, and zinc at $1.31 in the quarter. As commodity prices rise, Newmont's realized average price rises and margins improve. However, the gains may not be fully reflected in its share price. Newmont's all-in-sustainable costs (AISC) are around $1,000 per ounce. AISC includes all costs relating to maintaining existing production levels, general and administrative costs, direct operating costs, and exploration expenses. As gold prices rise, margins continue to improve, especially since Newmont expects AISC to decline moving forward.
Production is Expected to Ramp Up in the Second Half of 2024
Like Barrick Gold, Newmont experienced a production drop in Q2 2024, but rising gold and commodities prices juiced up margins. The company, like Barrick Gold, expects production to ramp up in the second half of 2024. While Barrick's production slumped due to scheduled maintenance issues, Newmont suspended operations at its Cerro Negro mine in early April 2024 due to fatalities which were further impacted by adverse weather in heavy rainfalls at its Lihir mine. Production fell to 1.68 million ounces and 477,000 gold equivalent ounces (GEOs) from silver, copper, lead, and zinc.
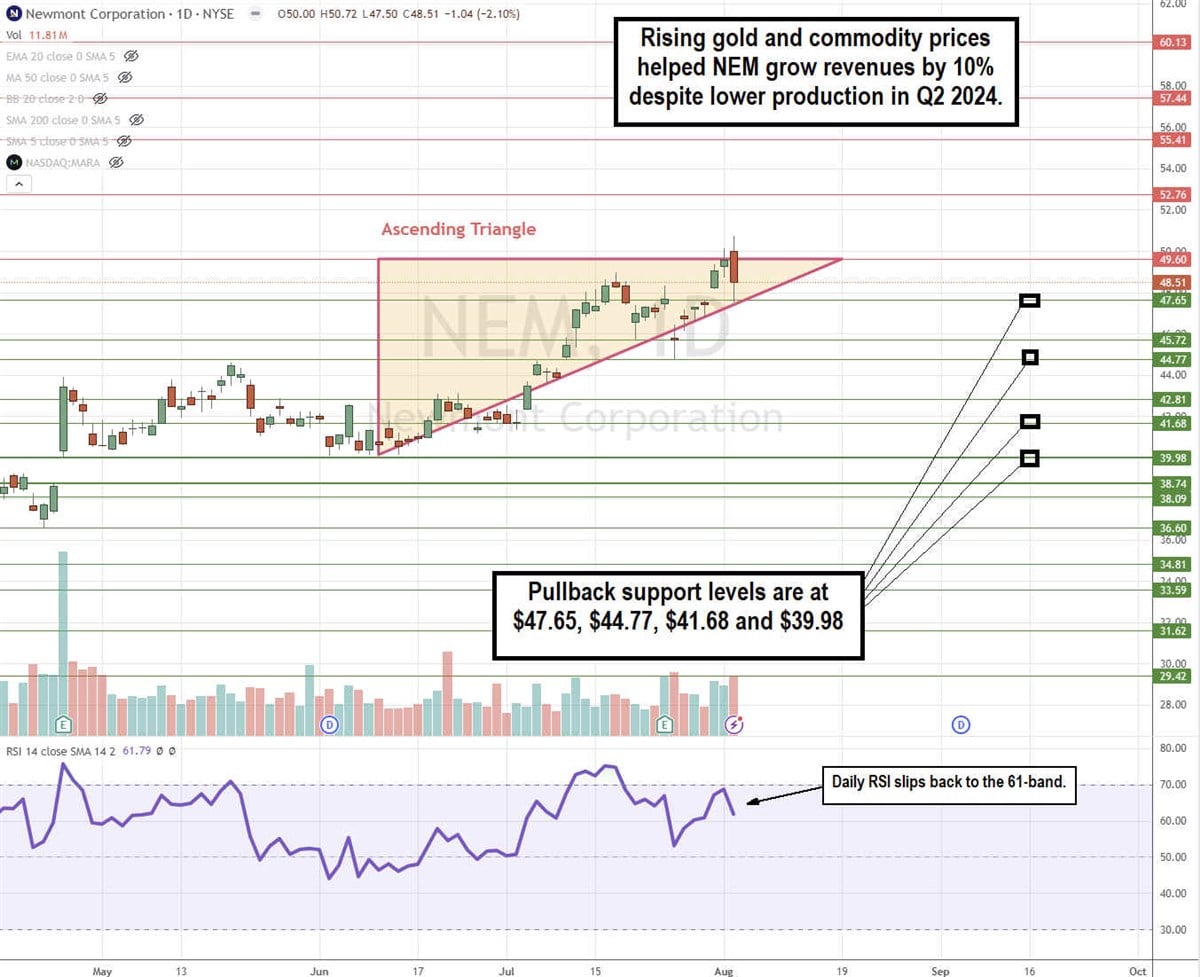
NEM Stock is Attempting an Ascending Triangle Breakout
The daily candlestick chart for NEM illustrates an ascending triangle pattern. The pattern is comprised of the flat-top upper trendline resistance at $49.60, which is the immovable object. The rising lower trendline is the unstoppable force. As the channel gets tighter as NEM moves towards the apex, shares will either break out through the upper trendline resistance or break down under the rising lower trendline. The daily relative strength index (RSI) peaked at the 70-band and has fallen to the 61-band. Pullback support levels are at $47.65, $44.77, $41.68, and $39.98.
Newmont Revenues Surge 64% YoY
Newmont reported Q2 2024 EPS of 72 cents, beating consensus estimates by 10 cents. Revenues surged 64.1% YoY to $4.4 billion, beating $4.13 billion consensus estimates. Gold production decreased 4% YoY to 1.68 million ounces stemming from the suspension of operations at Cerro Negro following the tragic fatalities of two workers on April 9, 2024. Operations resumed on May 24, 2024. The company expects to achieve $2 billion in gross divestiture proceeds.
Newmont CEO Tim Palmer commented, "Newmont delivered a solid second quarter, producing 2.1 million gold equivalent ounces and generating $594 million in free cash flow. We continued to advance our divestiture program and, to date, have announced $527 million in proceeds this year. With this momentum, we completed $250 million in share repurchases and repaid $250 million in debt.”
Newmont analyst ratings and price targets are at MarketBeat. There are 16 analyst ratings on NEM stock, comprised of two Strong Buys, eight Buys, and six Holds. The stock has a 3.07% upside to the consensus price target of $50.00 per share.


