 The natural gas and liquified natural gas (LNG) industry has struggled for the last few years but is gaining traction today and is expected to sustain itself in 2025. Increasing demand only partially offset by supply supports the price action in LNG and creates a strong tailwind for U.S. LNG stocks. That tailwind includes increased exports compounded by higher prices and a lever for margin and earnings. Earnings are critical to this market because of cash flow and capital returns, which are robust. The driver of demand is industrial. Industries are turning to natural gas globally to reduce their emissions, and demand will increase over time as infrastructure and services are improved.
The EIA expects LNG prices to average $3.00 in 2025, but the forecast may be low because of new projects coming online. Two projects, Plaquemines LNG Phase 1 and Cheniere’s Corpus Christi Phase 3, will account for at least 75% of the capacity coming online this year. Regardless, a $3.00 average is about 36% above the 2024 average, with U.S. exports forecasted to rise by 17%. The takeaway is that natural gas is reaching a critical mass, and U.S. LNG companies are well-positioned to benefit.
Cheniere: Growing and Building Leverage in 2025
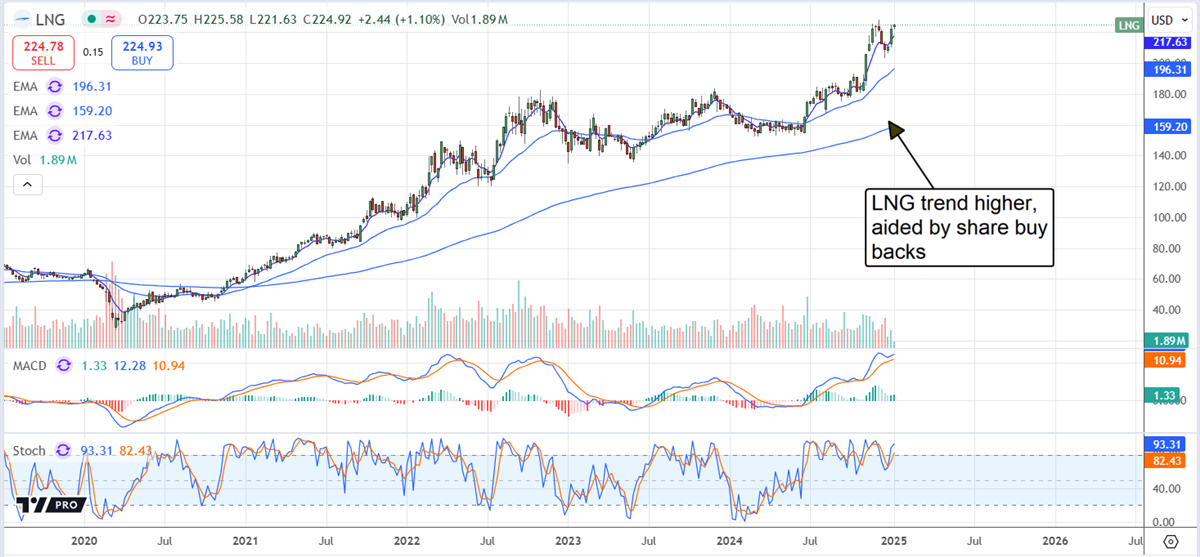
Cheniere (NYSE: LNG) is the largest natural gas exporter in the U.S. and is expected to grow revenue by nearly 20% in 2025. The analysts tracked by MarketBeat also forecast solid earnings but expect a deep year-over-year decline due to capital spending projects, including the completion of Corpus Christie Phase 3. That impact will fade quickly, leaving the company with increased capacity and improved earnings to sustain its healthy balance sheet and capital returns.
The outlook for capital return from Cheniere is robust, including the dividend and share repurchases. The dividend yield isn’t large, about 0.9%, with shares trading near 18x earnings, but it is reliable, the distribution is expected to grow, and share repurchases are significant. Share repurchases reduced the average diluted count by 6.2% in Q3 and 5.6% for the first nine months of fiscal 2024. Regarding the balance sheet, the improving cash flow allows for debt reduction, leaving long-term debt leverage at 2.4x and equity up by 3.65%.
Analysts rate the stock as a Moderate Buy and are lifting their price targets for 2025. The consensus implies fair value near early January prices, but it has been up 35% in the last twelve months, with revisions leading to the $260 level. A move to $260 is worth 35% of upside from critical resistance levels.
High-Yield Kinder Morgan Rises on Forecasts
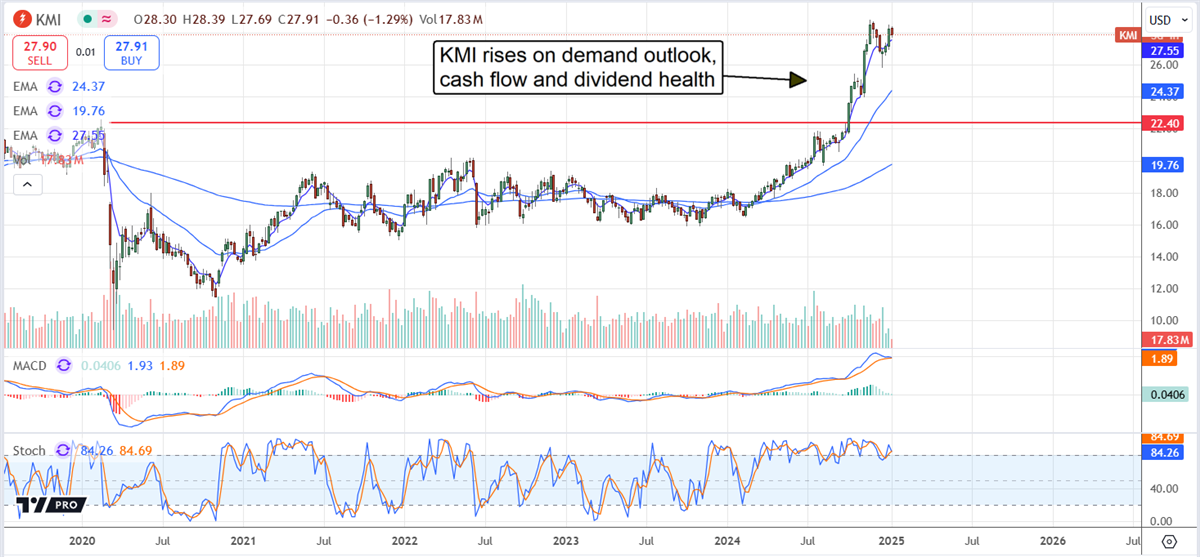
Kinder Morgan (NYSE: KMI) is well-positioned for 2025’s LNG boom as a middleman connecting the U.S. natural gas producers with the end markets, including export terminals. It operates roughly 79,000 miles of pipelines, liquefaction, storage, and distribution terminals to support them. Its revenue and earnings aren’t tied to the price of LNG so much as the volume of gas transported, which is rising. The volume is increasing because of the increased demand, acquisitions, and capital projects and is expected to continue rising for the next few years.
Analysts' sentiment is driving the price action in KMI stock higher. The consensus lags the market in early January, but it has been up more than 30% in the last twelve months, with revisions leading to the mid-$30s. A move to the mid-$30s is worth a 25% gain from the critical resistance target.
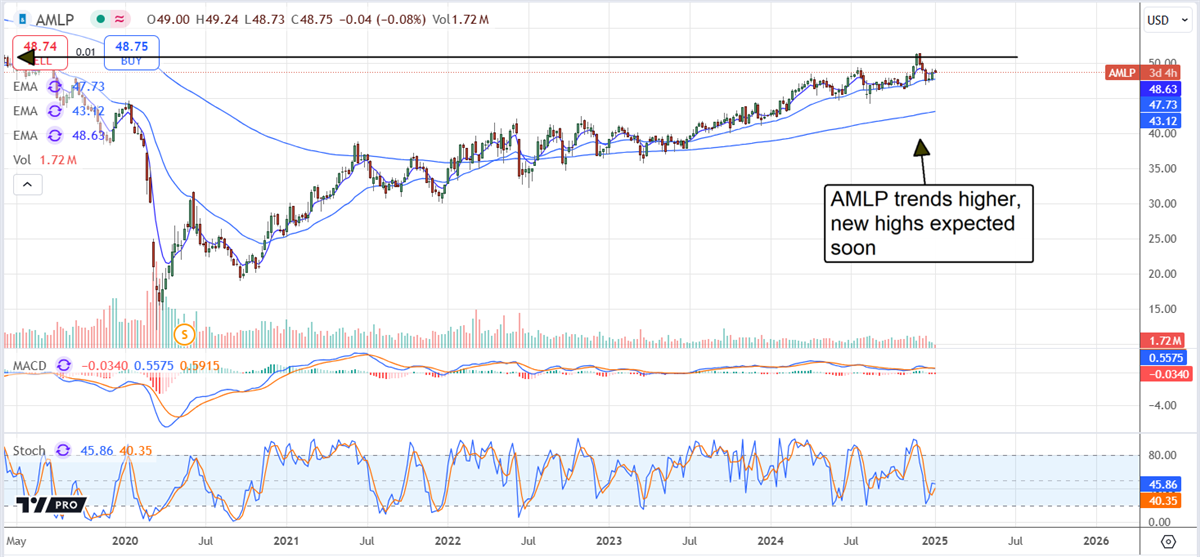
ETF Investors Should Turn to AMLP
ETF investors also have options. The Alerian MLP ETF (NYSEARCA: AMLP) targets the U.S. LNG middlemen and pays a high yield.
The dividend distribution is worth more than 7.5% at the start of 2025, with distributions and share buybacks expected to grow.
The technical action is also promising, with the stock trending higher. The price action in 2024 had the market testing resistance at a long-term high that is likely to break in early 2025.