Ollie’s Bargain Outlet (NASDAQ: OLLI) experienced a game-changing event with Big Lots' bankruptcy. The company is rushing to fill the void, having already acquired more than 60 location leases and planning to accelerate its store openings. The new guidance includes a 50% increase in expected 2025 store openings to 75, a 13% increase that amplifies the long-term growth outlook for this off-price retailer.
At the end of fiscal 2024, Ollie’s operated 559 stores in 31 states and can easily reach its goal of doubling in size over the next few years as it expands into new territories and deepens penetration of the existing ones. The takeaway is that a once-regional operator is on track for a nationwide expansion that will elevate it into the ranks of leading retailers, including Walmart (NYSE: WMT) and TJX Companies (NYSE: TJX), and likely outgrow its forecasts.
Ollie’s Tepid Results: No Barrier to Higher Stock Prices
Ollie’s Q4 results were tepid relative to the analysts' expectations, with revenue falling slightly short of MarketBeat’s reported consensus and earnings as expected. However, the results are no barrier to higher share prices because the bar was set high with revisions, and it was a tough comp versus 53 weeks.
So, the $667.1 million in net revenue is up only 2.8% reported, compared to the forecasts for slightly more substantial growth, but the adjusted figure is much stronger at 8.5%. The 8.5% adjusted figure outpaces competitors, including Target (NYSE: TGT), Walmart, and The TJX Companies, in Q4 and aligns with industry-leading Costco (NASDAQ: COST), expected to be accelerated in F2025.
[content-module:Forecast|NASDAQ: OLLI]Margin is an area of strength. The company experienced margin pressures, including acquiring Big Lots locations, but far less than expected. The result is an adjusted EPS of $1.19, down year-over-year but as expected compared to the weakness in top-line results.
The critical detail is that cash flow remains solid despite the accelerated growth strategy, sustaining the fortress balance sheet and allowing the board to increase the buyback authorization by $300 million. The $300 million is worth about 5% of the pre-release market cap and can help support the stock price and sustain its uptrend in 2025.
Ollie’s balance sheet is central to its investment quality. The balance sheet reflects the acquisition of Big Lots leases, with total liabilities increasing, but the gains are more than offset by other factors. The cash flow positive quarter allowed the company to rebuild its cash position; cash, investments, and inventory are up, the balance sheet is net cash, and total assets are up, leaving shareholder equity up by 12%.
The debt is primarily lease holdings, which amount to $480 million but are critical to the revenue and earnings growth outlook. Long-term debt is low and barely registers at 0.05x cash.
Institutions Bought Ollie’s at Bargain Prices: Analysts Lead to Higher Price Points
Institutional and analyst activity is bullish for Ollie’s market, with institutions buying heavily in Q1 and analysts providing a tailwind for price action. Institutional activity is noteworthy because the Q1 activity is a multi-year high that lifts total ownership to nearly 100% despite the relatively high 5% short interest.
Likewise, the analysts’ trends include increased coverage relative to Q1 2024, a firm Moderate Buy rating, and a consensus forecast for at least a 20% upside and a possible fresh all-time high based on 14 reports.
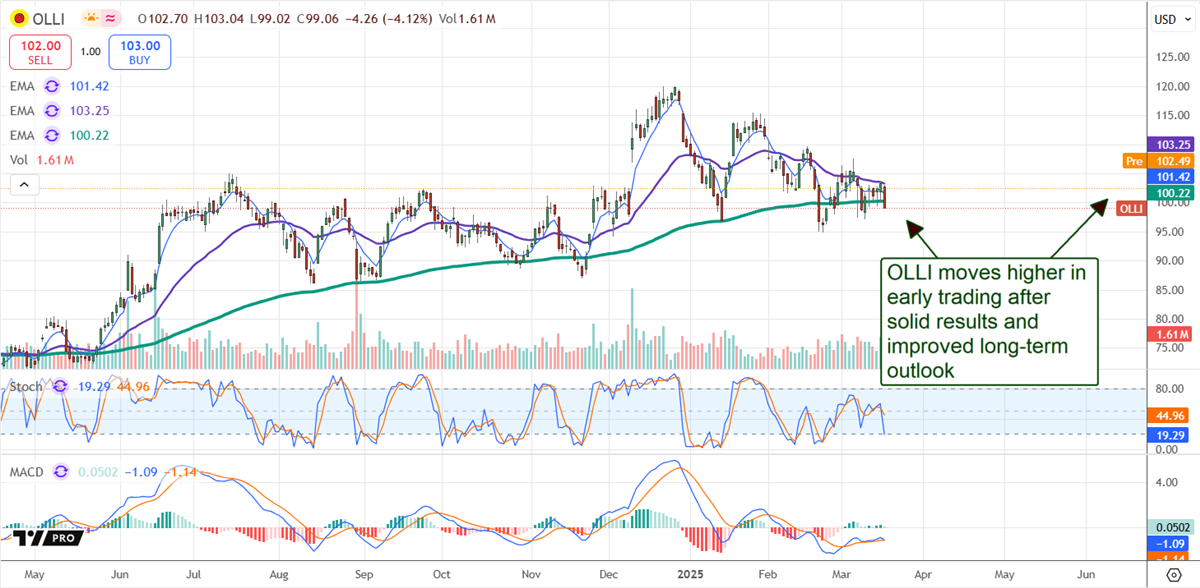
The post-release price action is promising. The market rose more than 3% to show support at the cluster of moving averages. Support is echoed in the indicators, which show strengthening support at current levels, which is also seen in the trading volume.
Trading volume is not spectacularly high, but it rose steadily, leading to the report showing a market eager to buy this stock at value prices. Assuming investors and traders follow through on the signals, this market can easily advance to retest the current highs. Critical resistance targets are $105, $110, and $115.
Where Should You Invest $1,000 Right Now?
Before you make your next trade, you'll want to hear this.
MarketBeat keeps track of Wall Street's top-rated and best performing research analysts and the stocks they recommend to their clients on a daily basis.
Our team has identified the five stocks that top analysts are quietly whispering to their clients to buy now before the broader market catches on... and none of the big name stocks were on the list.
They believe these five stocks are the five best companies for investors to buy now...


