
Levi Strauss & Company’s (NYSE: LEVI) shift to a direct-to-consumer (DTC)-first operating model comes at the right time—and looks like the right move for the company’s future.
The iconic brand was hampered by sluggish growth that can be tied to hard-to-manage displays at third-party apparel vendors. Imagine the Levi’s section at your favorite store after a busy day, shoppers rifling through sizes and styles, making it difficult for storekeepers and other consumers to know what’s left. The DTC model makes it easy for consumers to find style and fit without the hassle and is seen in the results.
[content-module:MarketRank|NYSE: LEVI]The company’s revenue growth topped 3.4% for fiscal Q1 2025, aligning with MarketBeat’s reported consensus on strength in core business, direct-to-consumer, and women’s categories. The company grew 9% organically on a 12% increase in DTC. Wholesales grew by a smaller 5%. International business was regionally the strongest, up 9%, but the 8% U.S. growth is also solid. Regarding Women's, it grew by double-digits for another quarter and is now 38% of the total. Also, non-denim items continue to show strength and accounted for 35% of sales, helping cement the business's future.
DTC is also important for the margin. The DTC channels helped to improve the gross margin by 330 basis points and adjusted EBITDA margin by 400 basis points due to price realization aided by cost reductions and brand shifts. The critical detail is that adjusted diluted earnings are up by 52% to $0.38 in FQ1, outpacing consensus by nearly 2500 basis points, and the margin is expected to remain robust as the year progresses. As for the guidance, the company reiterated its outlook, projecting 4% organic growth at the midpoint, 100 basis points of gross margin expansion, and Q2 adjusted EPS of $0.12 at the midpoint.
Levi’s Capital Return Is a Good Fit for Investors
Levi’s capital return is a good fit because of its high yield, relatively low cost, distribution growth outlook, and share buybacks. The dividend yields about 3.85% in early Q2 and is a safe and sustainable payout with a payout ratio of less than 20%.
The distribution growth history isn’t long and includes a short-lived, pandemic-related suspension, but it is otherwise healthy. The company has increased the distribution six times since 2021 and will likely continue lifting the payout regularly, if not annually. Buybacks are less robust, not even offsetting dilution in Q3, but may be increased due to the margin and revenue growth outlook.
Levi’s strong balance sheet reflects a position that can continue to return capital and increase distributions despite global economic uncertainty. Highlights from FQ1 include reduced cash and assets offset by reduced debt and liability, which left equity up by 3.2%. Leverage remains low at less than 0.5x equity, and liquidity is ample, over $1.4 billion, including cash on hand.
Analysts Forecast Double-Digit Upside for Levi’s Stock
The analysts’ response to Levi’s results and guidance is mixed, including several price target reductions. However, the reductions are offset by an upgrade to Overweight by JPMorgan, and this stock trades below the lowest analysts’ target. That target suggests a minimum of 10% upside in early April with the potential for a 45% gain by year’s end.
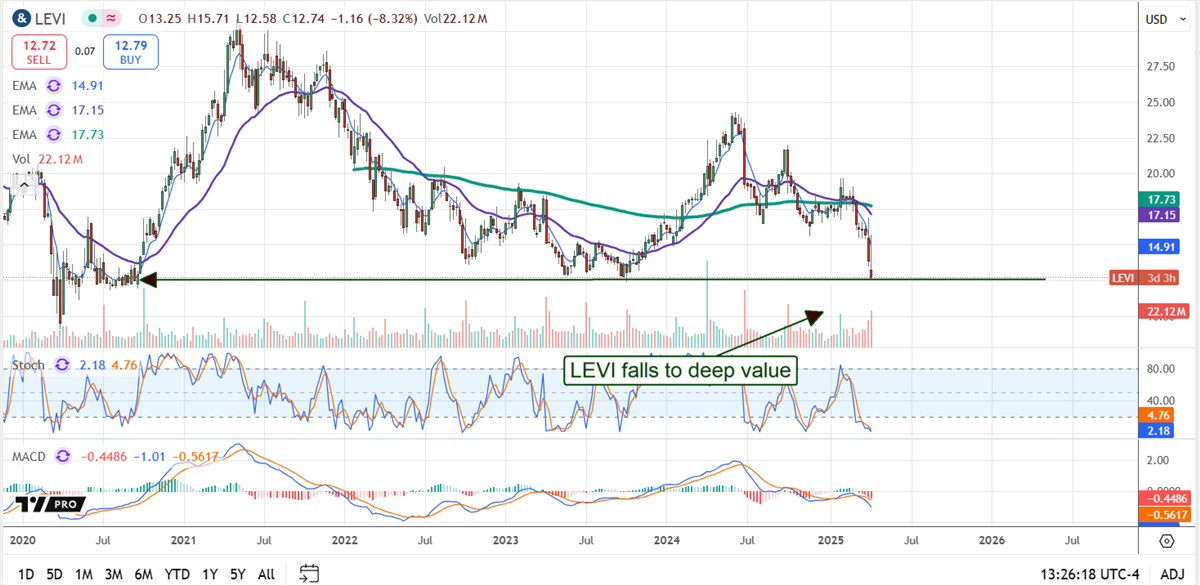
The initial market response to the news was bullish, but the analysts later tempered it. The result is a bearish candle showing resistance at a critical level and a market on the verge of new lows. If new lows are set soon, there is a risk that this stock could continue to trend lower in 2025, but that is if. Between then and now, the market will need to break through support near $12/$12.25, a level aligning with the pandemic bottom and the theoretical rock bottom for this stock.
Where Should You Invest $1,000 Right Now?
Before you make your next trade, you'll want to hear this.
MarketBeat keeps track of Wall Street's top-rated and best performing research analysts and the stocks they recommend to their clients on a daily basis.
Our team has identified the five stocks that top analysts are quietly whispering to their clients to buy now before the broader market catches on... and none of the big name stocks were on the list.
They believe these five stocks are the five best companies for investors to buy now...


