
Automotive retailer Lithia Motors (NYSE: LAD) missed Wall Street’s revenue expectations in Q3 CY2024, but sales rose 11.4% year on year to $9.22 billion. Its non-GAAP profit of $8.21 per share was 8.1% above analysts’ consensus estimates.
Is now the time to buy Lithia? Find out by accessing our full research report, it’s free.
Lithia (LAD) Q3 CY2024 Highlights:
- Revenue: $9.22 billion vs analyst estimates of $9.46 billion (2.5% miss)
- Adjusted EPS: $8.21 vs analyst estimates of $7.60 (8.1% beat)
- EBITDA: $421.4 million vs analyst estimates of $446.2 million (5.6% miss)
- Gross Margin (GAAP): 15.5%, down from 16.5% in the same quarter last year
- EBITDA Margin: 4.6%, down from 6.1% in the same quarter last year
- Free Cash Flow Margin: 1.7%, up from 0.7% in the same quarter last year
- Same-Store Sales fell 6.2% year on year (-1.1% in the same quarter last year)
- Market Capitalization: $8.14 billion
"Our third quarter performance was strong and demonstrated the team's ability to grow our business, leveraging size and scale and seizing new opportunities while focusing on operational efficiency. Our core businesses showed consistent growth while delivering substantial cost savings, and our adjacent operations continued building momentum, positioning us well for the future," said Bryan DeBoer, President and CEO.
Company Overview
With a strong presence in the Western U.S., Lithia Motors (NYSE: LAD) sells a wide range of vehicles, including new and used cars, trucks, SUVs, and luxury vehicles from various manufacturers.
Vehicle Retailer
Buying a vehicle is a big decision and usually the second-largest purchase behind a home for many people, so retailers that sell new and used cars try to offer selection, convenience, and customer service to shoppers. While there is online competition, especially for research and discovery, the vehicle sales market is still very fragmented and localized given the magnitude of the purchase and the logistical costs associated with moving cars over long distances. At the end of the day, a large swath of the population relies on cars to get from point A to point B, and vehicle sellers are acutely aware of this need.
Sales Growth
A company’s long-term performance can indicate its business quality. Any business can put up a good quarter or two, but many enduring ones grow for years.
Lithia is one of the larger companies in the consumer retail industry and benefits from a well-known brand that influences consumer purchasing decisions.
As you can see below, Lithia’s 22.9% annualized revenue growth over the last five years (we compare to 2019 to normalize for COVID-19 impacts) was incredible as it opened new stores and expanded its reach.
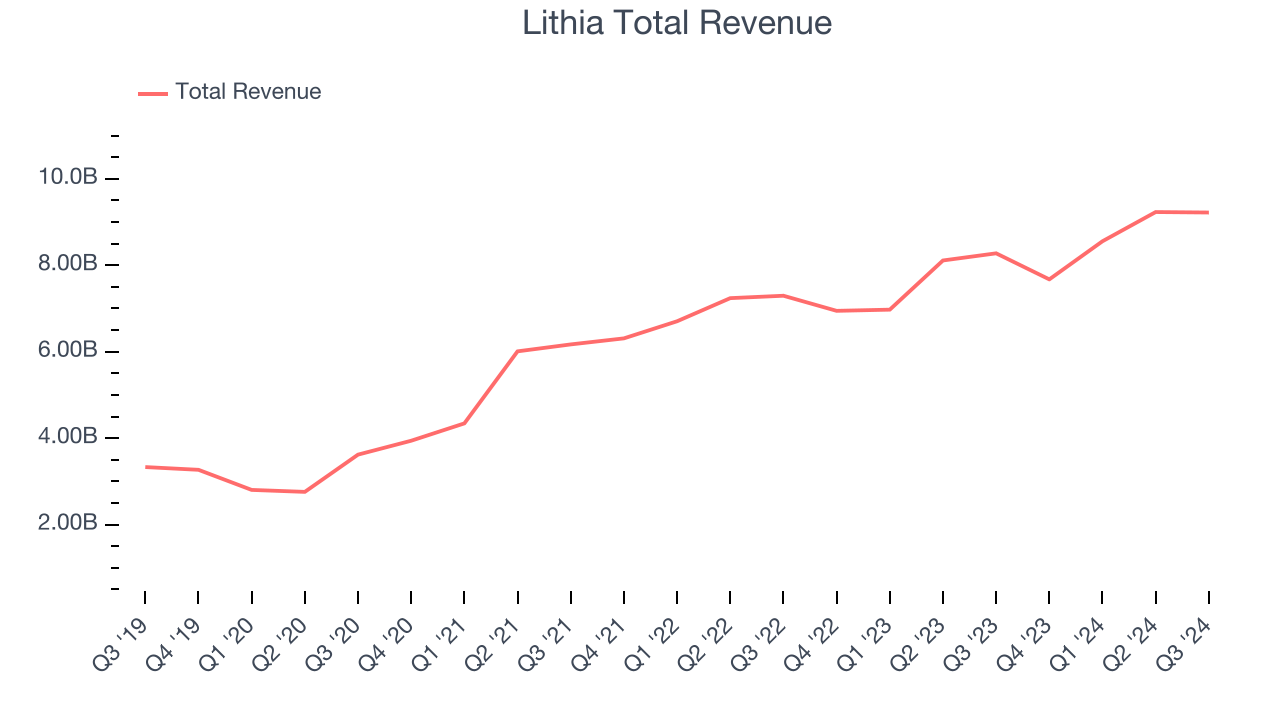
This quarter, Lithia’s revenue grew 11.4% year on year to $9.22 billion, falling short of Wall Street’s estimates.
Looking ahead, sell-side analysts expect revenue to grow 11% over the next 12 months, a deceleration versus the last five years. Some tapering is natural given the magnitude of its revenue base, and we still think its growth trajectory is attractive.
Today’s young investors won’t have read the timeless lessons in Gorilla Game: Picking Winners In High Technology because it was written more than 20 years ago when Microsoft and Apple were first establishing their supremacy. But if we apply the same principles, then enterprise software stocks leveraging their own generative AI capabilities may well be the Gorillas of the future. So, in that spirit, we are excited to present our Special Free Report on a profitable, fast-growing enterprise software stock that is already riding the automation wave and looking to catch the generative AI next.
Store Performance
Number of Stores
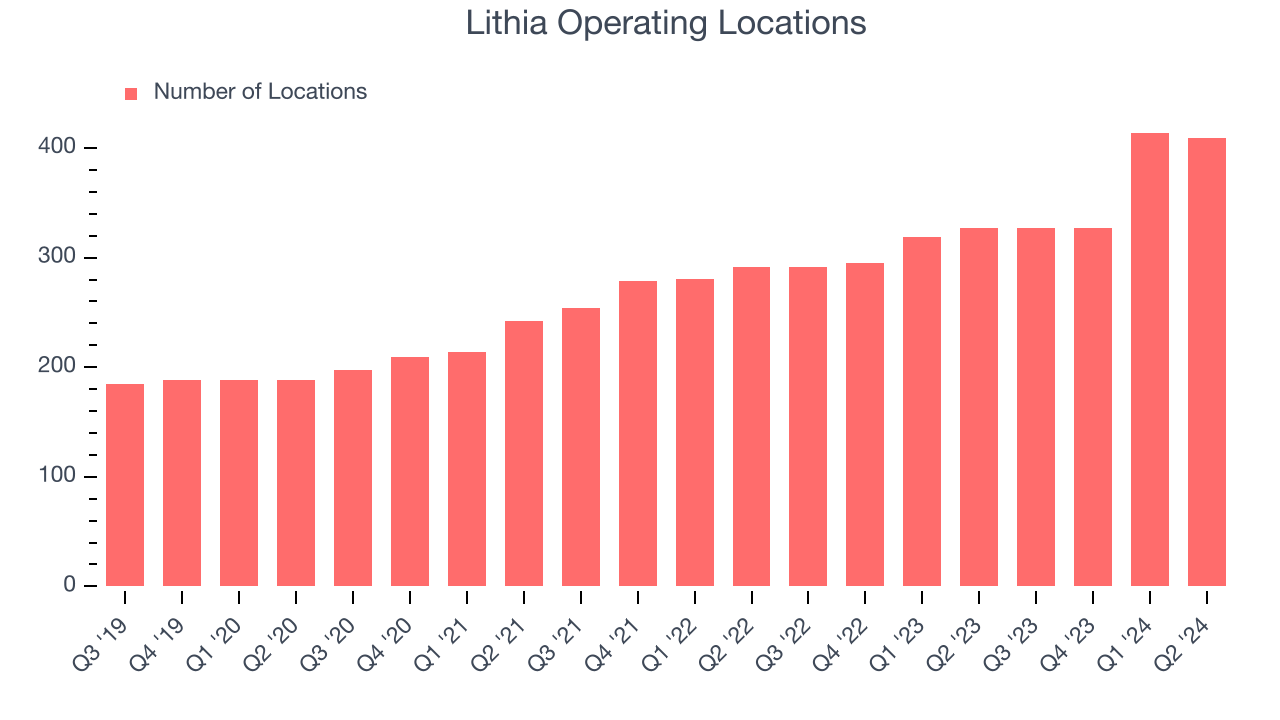
Over the last two years, Lithia opened new stores at a rapid clip and averaged 15.7% annual growth, among the fastest in the consumer retail sector.
When a retailer opens new stores, it usually means it’s investing for growth because demand is greater than supply, especially in areas where consumers may not have a store within reasonable driving distance.
Note that Lithia reports its store count intermittently, so some data points are missing in the chart below.
Same-Store Sales
The change in a company's store base only tells one side of the story. The other is the performance of its existing locations and e-commerce sales. Same-store sales gives us insight into this topic because it measures organic growth for a retailer's e-commerce platform and brick-and-mortar shops that have existed for at least a year.
Lithia’s demand has been shrinking over the last two years as its same-store sales have averaged 3.1% annual declines. This performance is concerning as it shows Lithia artificially boosts its revenue by building new stores. We’d like to see a company’s same-store sales rise before it takes on the costly, capital-intensive endeavor of expanding its store base.
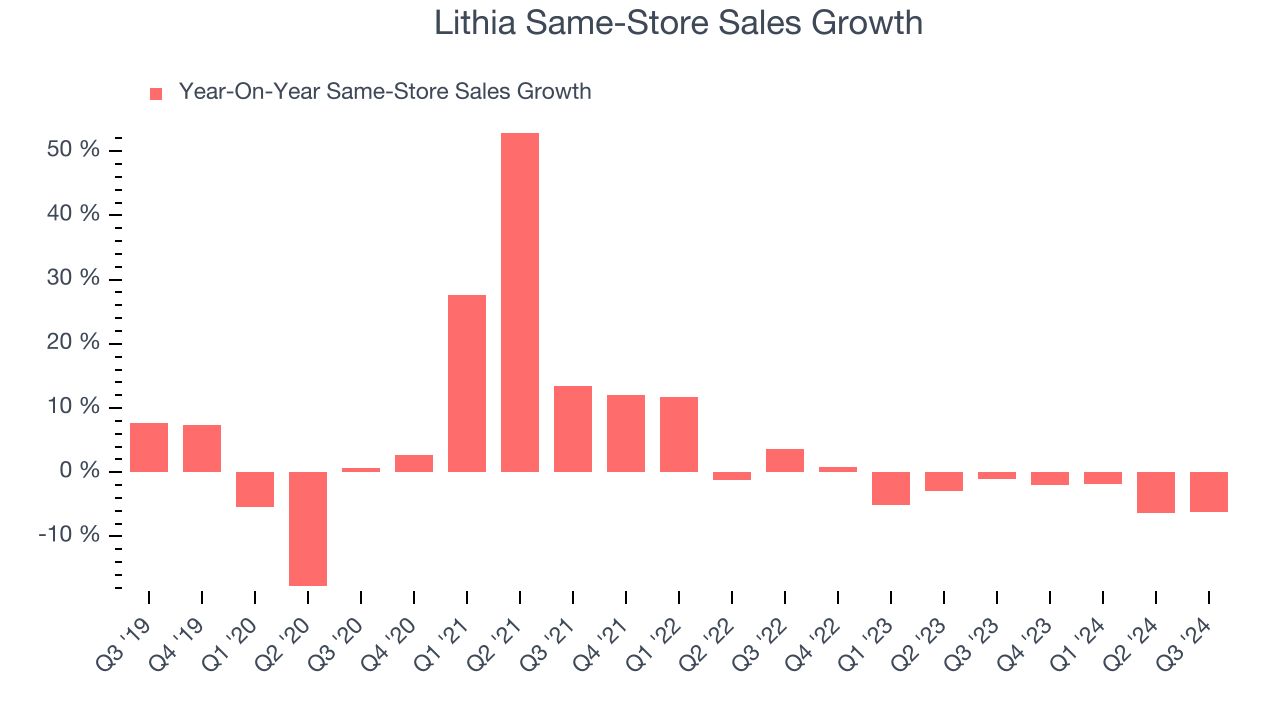
In the latest quarter, Lithia’s same-store sales fell by 6.2% annually. This decrease was a further deceleration from the 1.1% year-on-year decline it posted 12 months ago. We hope the business can get back on track.
Key Takeaways from Lithia’s Q3 Results
It was good to see Lithia beat analysts’ EPS expectations this quarter. On the other hand, its revenue and EBITDA missed and its revenue missed Wall Street’s estimates. Overall, this was a weaker quarter. The stock remained flat at $306 immediately after reporting.
Is Lithia an attractive investment opportunity at the current price?When making that decision, it’s important to consider its valuation, business qualities, as well as what has happened in the latest quarter. We cover that in our actionable full research report which you can read here, it’s free.