
Luxury casino and resort operator Monarch (NASDAQ: MCRI) beat Wall Street’s revenue expectations in Q3 CY2024, with sales up 3.7% year on year to $137.9 million. Its GAAP profit of $1.47 per share was also 7.5% above analysts’ consensus estimates.
Is now the time to buy Monarch? Find out by accessing our full research report, it’s free.
Monarch (MCRI) Q3 CY2024 Highlights:
- Revenue: $137.9 million vs analyst estimates of $134.4 million (2.6% beat)
- EPS: $1.47 vs analyst estimates of $1.37 (7.5% beat)
- EBITDA: $50.64 million vs analyst estimates of $47.96 million (5.6% beat)
- Gross Margin (GAAP): 55%, in line with the same quarter last year
- Operating Margin: 25.6%, up from 24% in the same quarter last year
- EBITDA Margin: 36.7%, in line with the same quarter last year
- Market Capitalization: $1.36 billion
CEO Comment John Farahi, Co-Chairman and Chief Executive Officer of Monarch, commented: “Our 2024 third quarter results were strong, reflecting the strength and player appeal of our properties, amenities and service level. Third quarter net revenue and adjusted EBITDA were $137.9 million and $50.6 million, respectively, resulting in an EBITDA margin of 36.7%."
Company Overview
Established in 1993, Monarch (NASDAQ: MCRI) operates luxury casinos and resorts, offering high-end gaming, dining, and hospitality experiences.
Casino Operator
Casino operators enjoy limited competition because gambling is a highly regulated industry. These companies can also enjoy healthy margins and profits. Have you ever heard the phrase ‘the house always wins’? Regulation cuts both ways, however, and casinos may face stroke-of-the-pen risk that suddenly limits what they can or can't do and where they can do it. Furthermore, digitization is changing the game, pun intended. Whether it’s online poker or sports betting on your smartphone, innovation is forcing these players to adapt to changing consumer preferences, such as being able to wager anywhere on demand.
Sales Growth
A company’s long-term performance is an indicator of its overall business quality. While any business can experience short-term success, top-performing ones enjoy sustained growth for multiple years. Luckily, Monarch’s sales grew at a decent 15.9% compounded annual growth rate over the last five years. This shows it was successful in expanding, a useful starting point for our analysis.
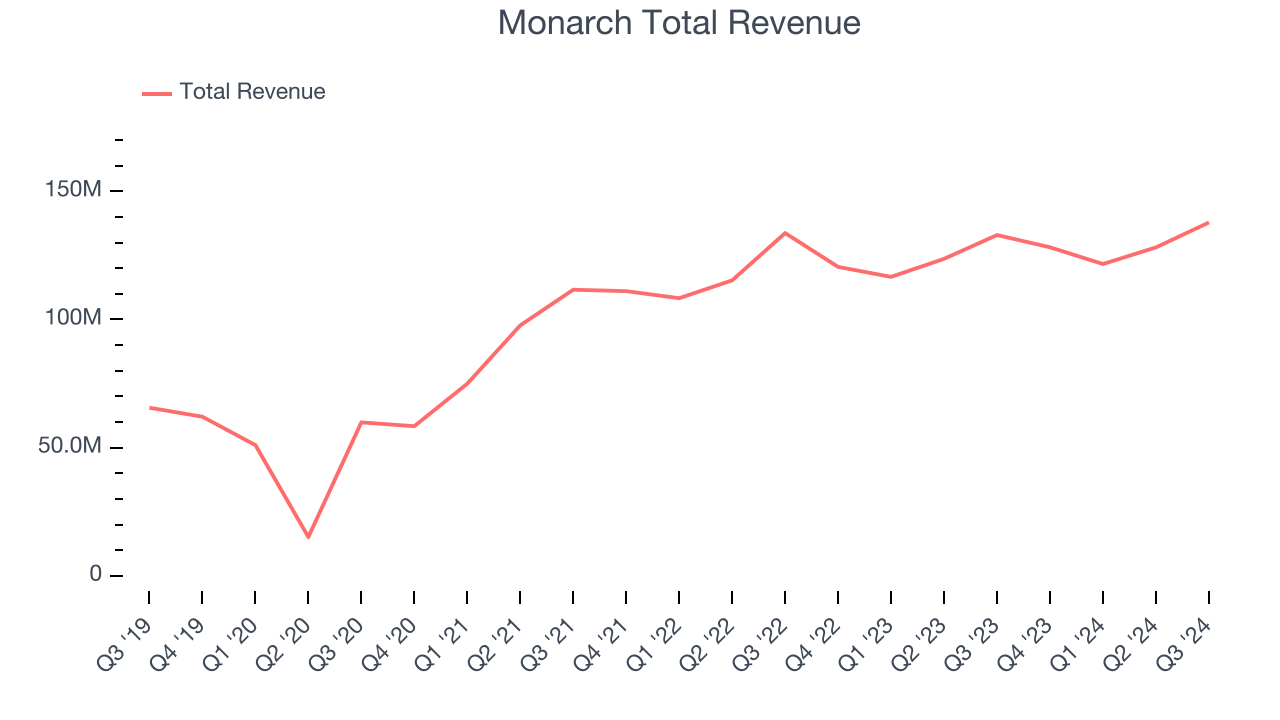
Long-term growth is the most important, but within consumer discretionary, product cycles are short and revenue can be hit-driven due to rapidly changing trends and consumer preferences. Monarch’s recent history shows its demand slowed as its annualized revenue growth of 4.9% over the last two years is below its five-year trend. Note that COVID hurt Monarch’s business in 2020 and part of 2021, and it bounced back in a big way thereafter.
We can dig further into the company’s revenue dynamics by analyzing its three most important segments: Casino, Dining, and Hotel, which are 55.3%, 23.9%, and 15.7% of revenue. Over the last two years, Monarch’s revenues in all three segments increased. Its Casino revenue (Poker, Blackjack) averaged year-on-year growth of 4% while its Dining (food and beverage) and Hotel (overnight stays) revenues averaged 6.7% and 4.9%.
This quarter, Monarch reported modest year-on-year revenue growth of 3.7% but beat Wall Street’s estimates by 2.6%.
Looking ahead, sell-side analysts expect revenue to remain flat over the next 12 months, a deceleration versus the last two years. This projection doesn't excite us and indicates the market thinks its products and services will face some demand challenges.
When a company has more cash than it knows what to do with, buying back its own shares can make a lot of sense–as long as the price is right. Luckily, we’ve found one, a low-priced stock that is gushing free cash flow AND buying back shares. Click here to claim your Special Free Report on a fallen angel growth story that is already recovering from a setback.
Cash Is King
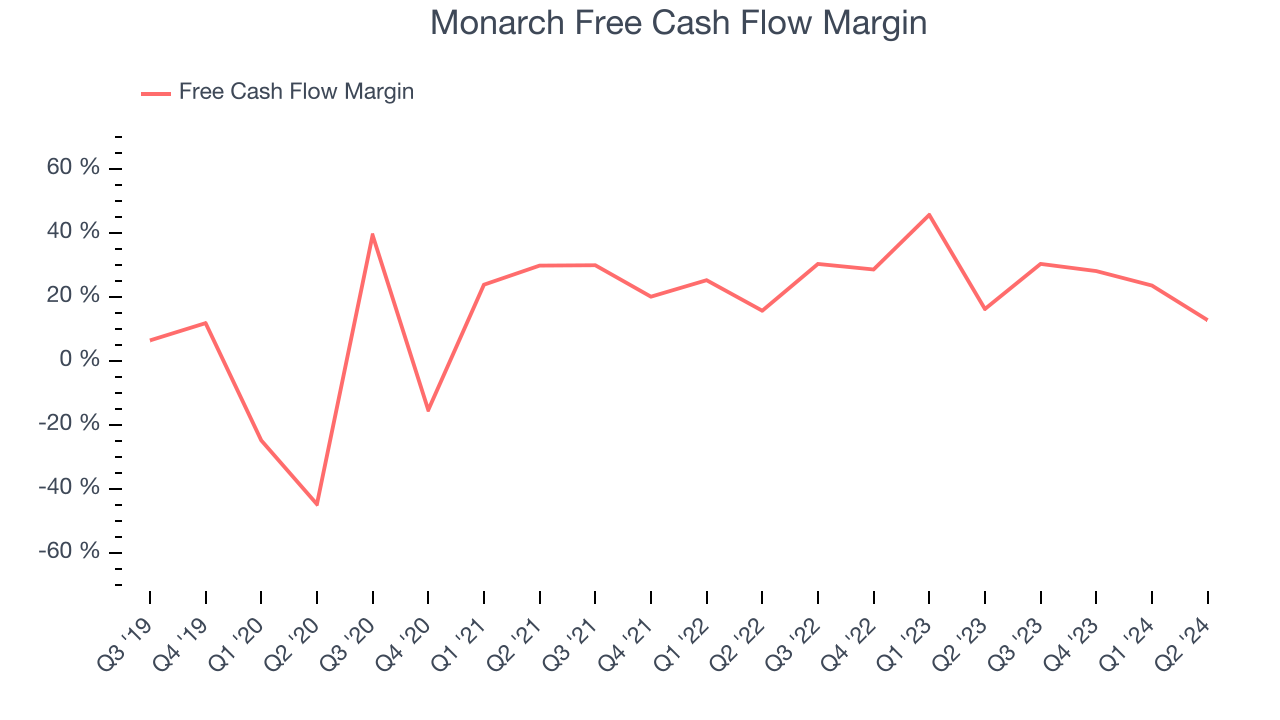
Free cash flow isn't a prominently featured metric in company financials and earnings releases, but we think it's telling because it accounts for all operating and capital expenses, making it tough to manipulate. Cash is king.
Monarch has shown terrific cash profitability, enabling it to reinvest, return capital to investors, and stay ahead of the competition while maintaining an ample cushion. The company’s free cash flow margin was among the best in the consumer discretionary sector, averaging 26.3% over the last two years.
Key Takeaways from Monarch’s Q3 Results
It was good to see Monarch beat analysts’ revenue expectations this quarter. We were also glad its EPS outperformed Wall Street’s estimates. Overall, this quarter had some key positives. The stock remained flat at $73.64 immediately following the results.
Big picture, is Monarch a buy here and now?If you’re making that decision, you should consider the bigger picture of valuation, business qualities, as well as the latest earnings. We cover that in our actionable full research report which you can read here, it’s free.


