Machinery provider H&E (NASDAQ: HEES) met Wall Street’s revenue expectations in Q3 CY2024, but sales fell 4% year on year to $384.9 million. Its GAAP profit of $0.85 per share was 12.7% below analysts’ consensus estimates.
Is now the time to buy H&E Equipment Services? Find out by accessing our full research report, it’s free.
H&E Equipment Services (HEES) Q3 CY2024 Highlights:
- Revenue: $384.9 million vs analyst estimates of $388.2 million (in line)
- EPS: $0.85 vs analyst expectations of $0.97 (12.7% miss)
- EBITDA: $175.3 million vs analyst estimates of $176.7 million (small miss)
- Gross Margin (GAAP): 44.5%, down from 47% in the same quarter last year
- Operating Margin: 15.8%, down from 19.8% in the same quarter last year
- EBITDA Margin: 45.6%, down from 47.2% in the same quarter last year
- Market Capitalization: $2.04 billion
“Industry fundamentals in the third quarter continued to trail year-ago measures,” said Brad Barber, chief executive officer of H&E Rentals.
Company Overview
Founded after recognizing a growth trend along the Mississippi River and opportunities developing in the earthmoving and construction equipment business, H&E (NASDAQ: HEES) offers machinery for companies to purchase or rent.
Specialty Equipment Distributors
Historically, specialty equipment distributors have boasted deep selection and expertise in sometimes narrow areas like single-use packaging or unique lighting equipment. Additionally, the industry has evolved to include more automated industrial equipment and machinery over the last decade, driving efficiencies and enabling valuable data collection. Specialty equipment distributors whose offerings keep up with these trends can take share in a still-fragmented market, but like the broader industrials sector, this space is at the whim of economic cycles that impact the capital spending and manufacturing propelling industry volumes.
Sales Growth
A company’s long-term performance is an indicator of its overall business quality. While any business can experience short-term success, top-performing ones enjoy sustained growth for multiple years. Unfortunately, H&E Equipment Services’s 2.4% annualized revenue growth over the last five years was sluggish. This shows it failed to expand in any major way, a rough starting point for our analysis.
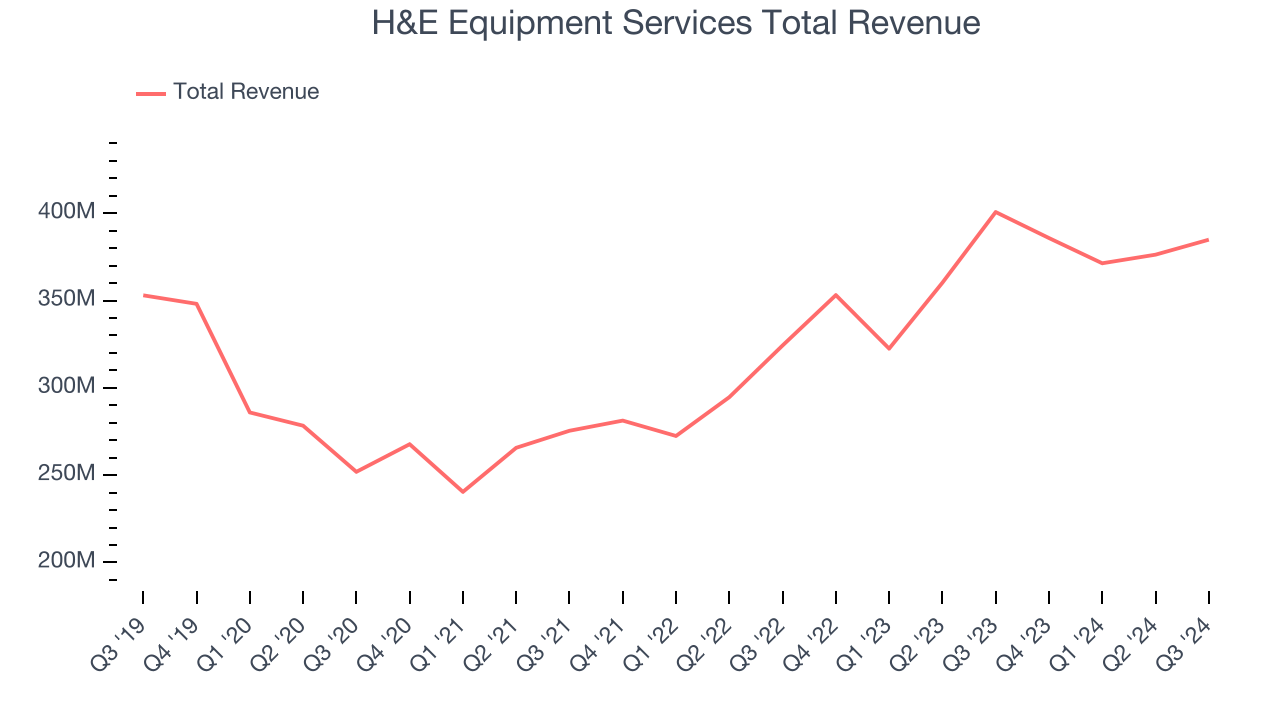
Long-term growth is the most important, but within industrials, a half-decade historical view may miss new industry trends or demand cycles. H&E Equipment Services’s annualized revenue growth of 13.8% over the last two years is above its five-year trend, suggesting its demand recently accelerated. 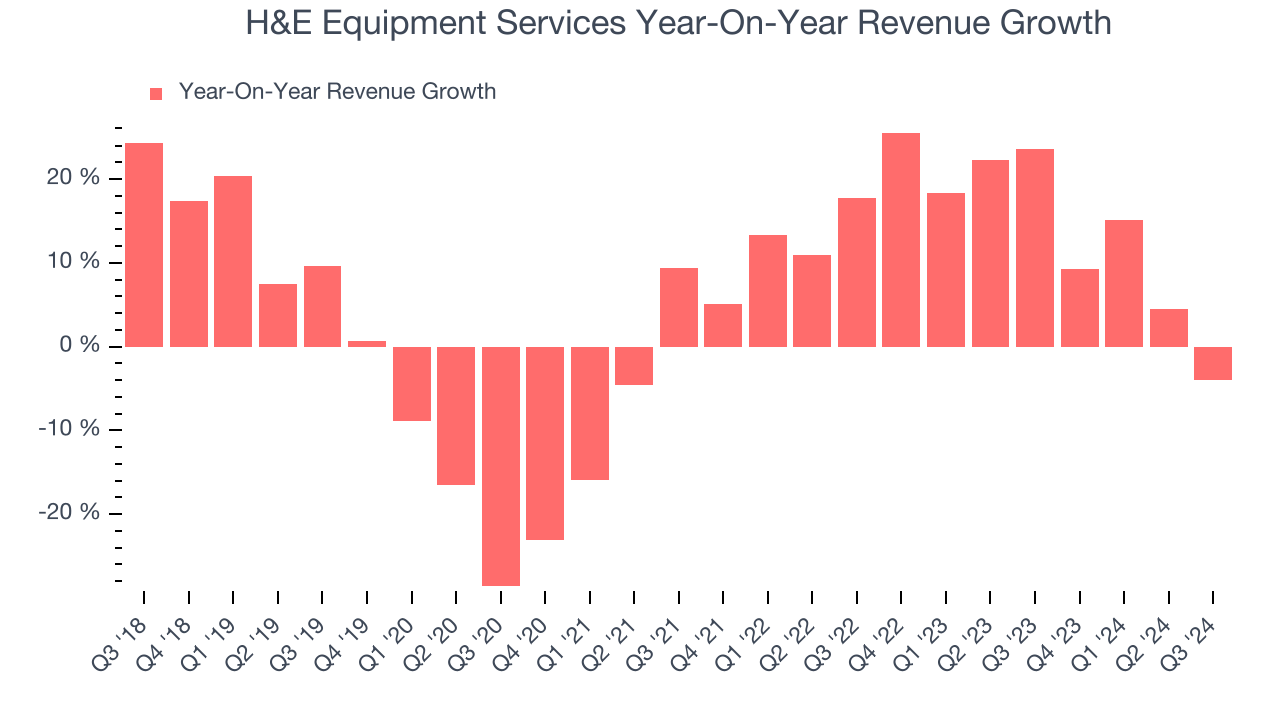
We can dig further into the company’s revenue dynamics by analyzing its most important segment, Equipment. Over the last two years, H&E Equipment Services’s Equipment revenue (rentals) averaged 19.7% year-on-year growth. This segment has outperformed its total sales during the same period, lifting the company’s performance.
This quarter, H&E Equipment Services reported a rather uninspiring 4% year-on-year revenue decline to $384.9 million of revenue, in line with Wall Street’s estimates.
Looking ahead, sell-side analysts expect revenue to grow 2.1% over the next 12 months, a deceleration versus the last two years. This projection is underwhelming and illustrates the market believes its products and services will face some demand challenges.
Here at StockStory, we certainly understand the potential of thematic investing. Diverse winners from Microsoft (MSFT) to Alphabet (GOOG), Coca-Cola (KO) to Monster Beverage (MNST) could all have been identified as promising growth stories with a megatrend driving the growth. So, in that spirit, we’ve identified a relatively under-the-radar profitable growth stock benefitting from the rise of AI, available to you FREE via this link.
Operating Margin
Operating margin is a key measure of profitability. Think of it as net income–the bottom line–excluding the impact of taxes and interest on debt, which are less connected to business fundamentals.
H&E Equipment Services has been an optimally-run company over the last five years. It was one of the more profitable businesses in the industrials sector, boasting an average operating margin of 14.3%. This result isn’t surprising as its high gross margin gives it a favorable starting point.
Looking at the trend in its profitability, H&E Equipment Services’s annual operating margin rose by 11.6 percentage points over the last five years, showing its efficiency has meaningfully improved.
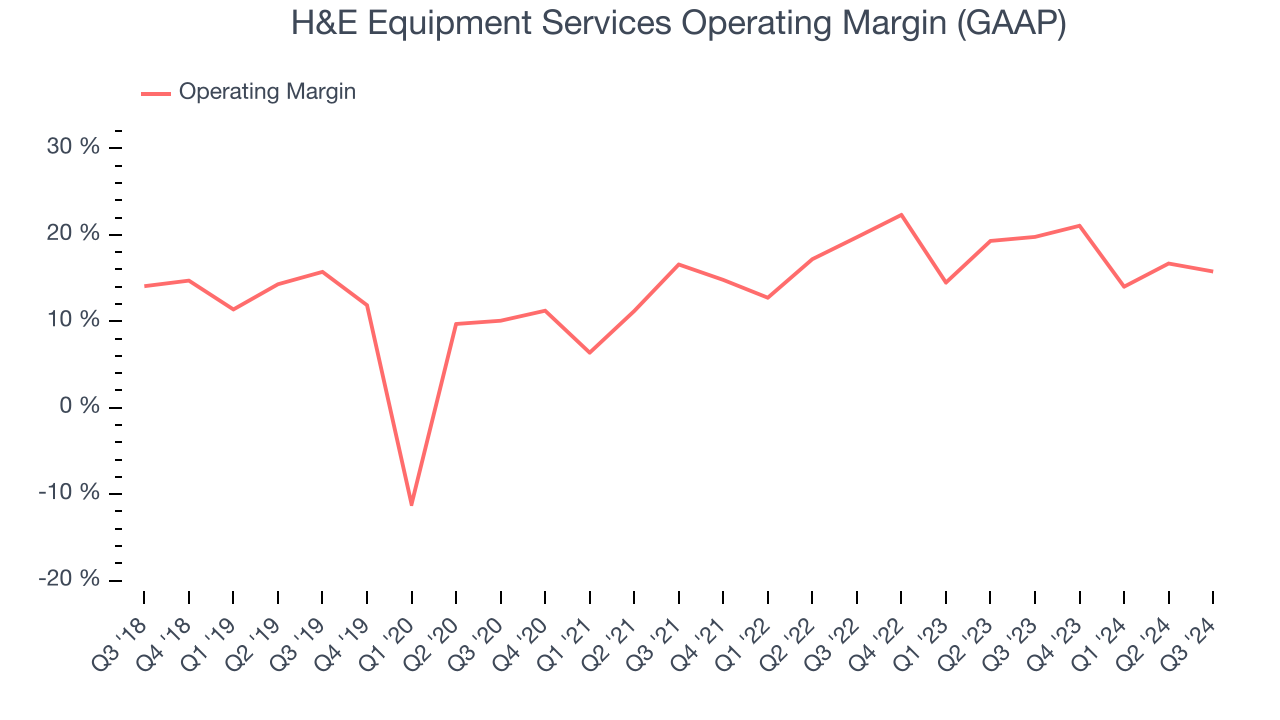
In Q3, H&E Equipment Services generated an operating profit margin of 15.8%, down 4 percentage points year on year. Since H&E Equipment Services’s operating margin decreased more than its gross margin, we can assume it was recently less efficient because expenses such as marketing, R&D, and administrative overhead increased.
Earnings Per Share
We track the long-term change in earnings per share (EPS) for the same reason as long-term revenue growth. Compared to revenue, however, EPS highlights whether a company’s growth was profitable.
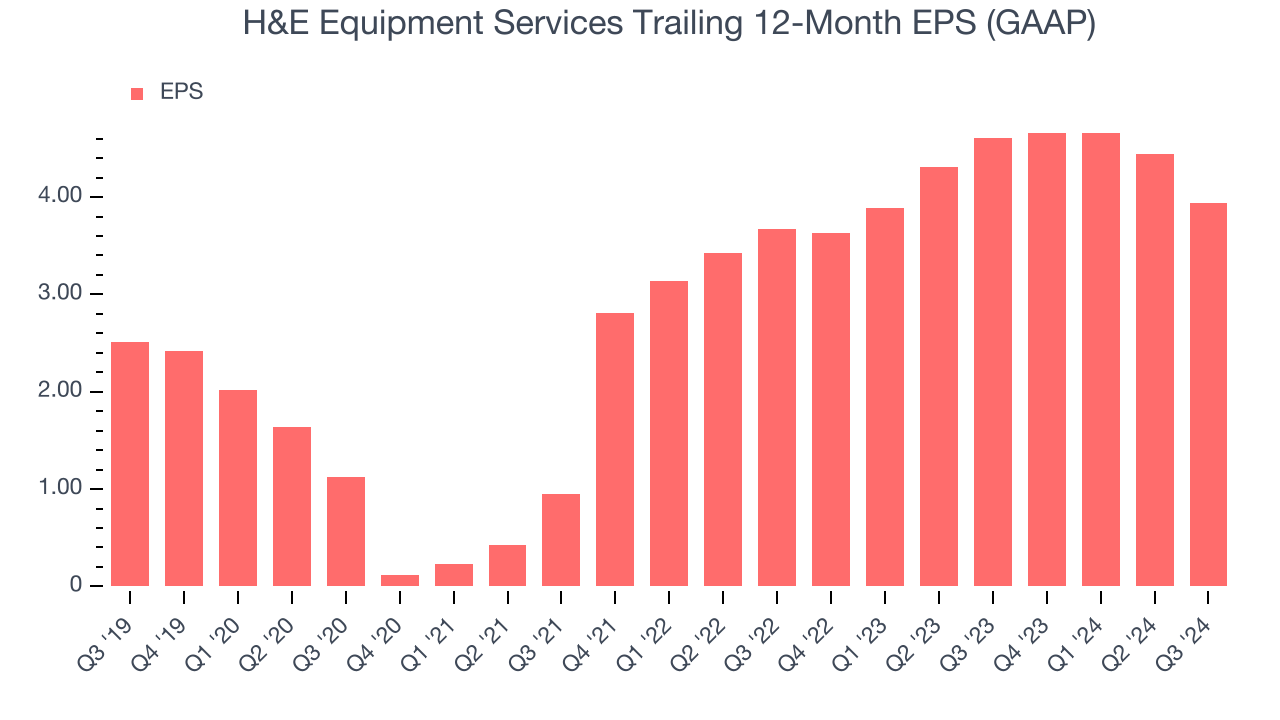
H&E Equipment Services’s EPS grew at a decent 9.4% compounded annual growth rate over the last five years, higher than its 2.4% annualized revenue growth. This tells us the company became more profitable as it expanded.
We can take a deeper look into H&E Equipment Services’s earnings quality to better understand the drivers of its performance. As we mentioned earlier, H&E Equipment Services’s operating margin declined this quarter but expanded by 11.6 percentage points over the last five years. This was the most relevant factor (aside from the revenue impact) behind its higher earnings; taxes and interest expenses can also affect EPS but don’t tell us as much about a company’s fundamentals.
Like with revenue, we analyze EPS over a more recent period because it can give insight into an emerging theme or development for the business.
For H&E Equipment Services, its two-year annual EPS growth of 3.7% was lower than its five-year trend. We hope its growth can accelerate in the future.In Q3, H&E Equipment Services reported EPS at $0.85, down from $1.35 in the same quarter last year. This print missed analysts’ estimates, but we care more about long-term EPS growth than short-term movements. Over the next 12 months, Wall Street expects H&E Equipment Services’s full-year EPS of $3.94 to shrink by 4.7%.
Key Takeaways from H&E Equipment Services’s Q3 Results
We struggled to find many strong positives in these results. Its EPS missed and its revenue fell short of Wall Street’s estimates. Overall, this was a softer quarter. The stock remained flat at $56.59 immediately after reporting.
H&E Equipment Services’s latest earnings report disappointed. One quarter doesn’t define a company’s quality, so let’s explore whether the stock is a buy at the current price. When making that decision, it’s important to consider its valuation, business qualities, as well as what has happened in the latest quarter. We cover that in our actionable full research report which you can read here, it’s free.