
Infrastructure investment and operations firm FTAI Infrastructure (NASDAQ: FIP) missed Wall Street’s revenue expectations in Q3 CY2024 as sales rose 3.2% year on year to $83.31 million. Its GAAP loss of $0.45 per share was also 13.4% below analysts’ consensus estimates.
Is now the time to buy FTAI Infrastructure? Find out by accessing our full research report, it’s free.
FTAI Infrastructure (FIP) Q3 CY2024 Highlights:
- Revenue: $83.31 million vs analyst estimates of $94.3 million (11.7% miss)
- EPS: -$0.45 vs analyst expectations of -$0.40 ($0.05 miss)
- EBITDA: $36.93 million vs analyst estimates of $37.67 million (2% miss)
- EBITDA Margin: 44.3%
- Free Cash Flow was -$11.66 million, down from $1.70 million in the same quarter last year
- Market Capitalization: $907.6 million
Company Overview
Spun off from FTAI Aviation in 2021, FTAI Infrastructure (NASDAQ: FIP) invests in and operates infrastructure and related assets across the transportation and energy sectors.
Energy Products and Services
Areas like the energy transition and emission reduction are thematic and front of mind today. This can be a double-edged sword for the energy products and services industry. Those who innovate and build new expertise can jolt demand while those who cling to legacy technologies or fall behind in the trending areas could see their market shares diminish. Bigger picture, energy products and services companies are still at the whim of construction and infrastructure project volumes, which tend to be cyclical and can be impacted heavily by economic factors such as interest rates.
Sales Growth
A company’s long-term performance can indicate its business quality. Any business can put up a good quarter or two, but many enduring ones grow for years. Luckily, FTAI Infrastructure’s sales grew at an incredible 51.1% compounded annual growth rate over the last three years. This is encouraging because it shows FTAI Infrastructure’s offerings resonate with customers, a helpful starting point.
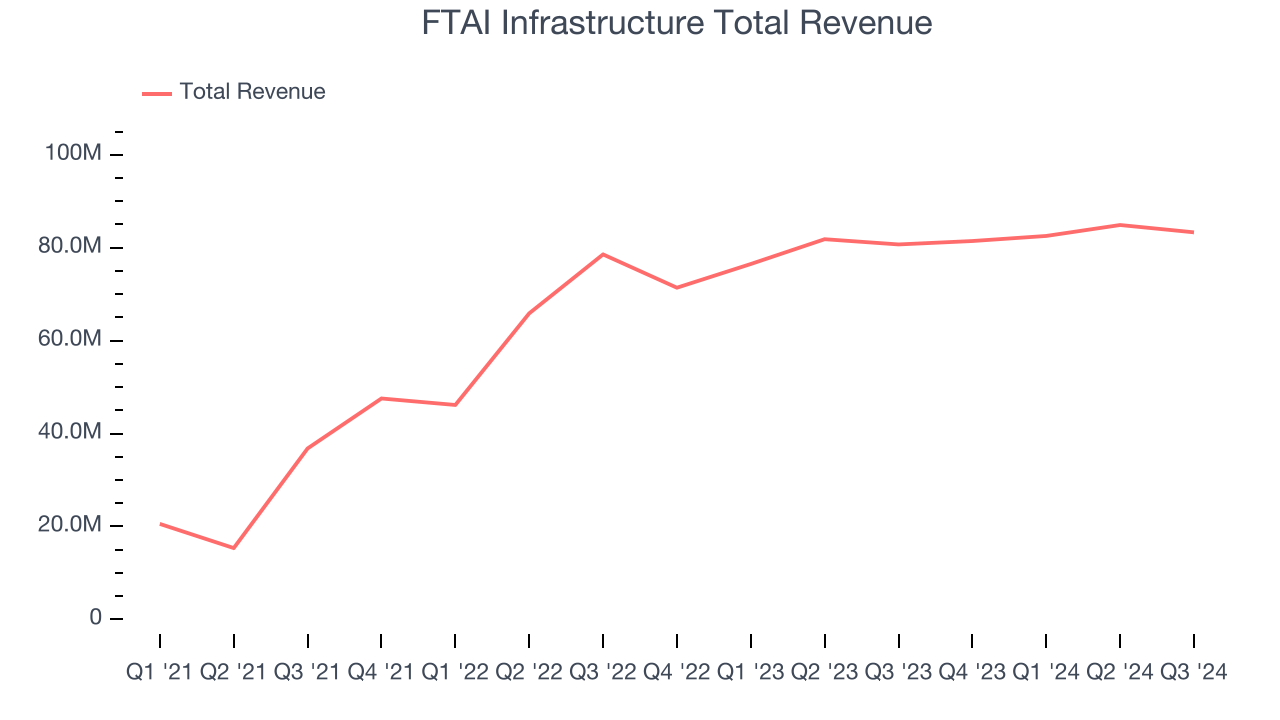
Long-term growth is the most important, but within industrials, a stretched historical view may miss new industry trends or demand cycles. FTAI Infrastructure’s annualized revenue growth of 18.1% over the last two years is below its three-year trend, but we still think the results were good and suggest demand was strong. 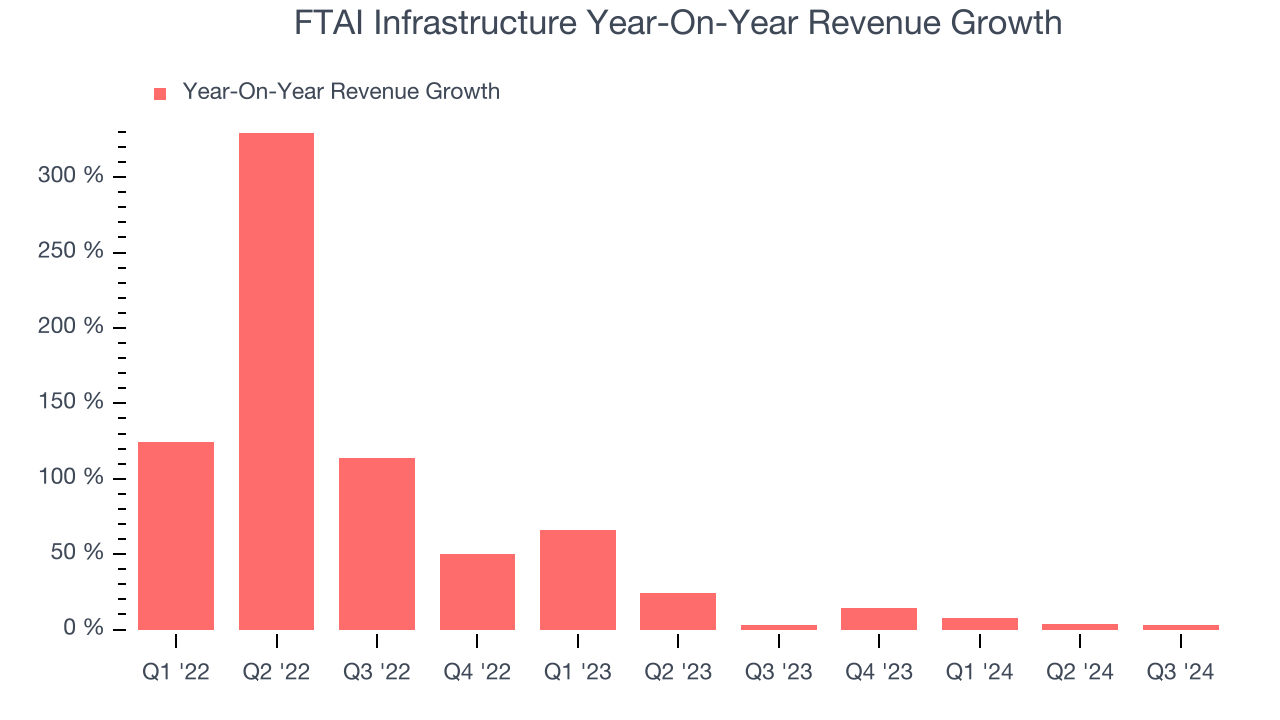
This quarter, FTAI Infrastructure’s revenue grew 3.2% year on year to $83.31 million, falling short of Wall Street’s estimates.
Looking ahead, sell-side analysts expect revenue to grow 31.1% over the next 12 months, an improvement versus the last two years. This projection is healthy and indicates the market believes its newer products and services will spur faster growth.
When a company has more cash than it knows what to do with, buying back its own shares can make a lot of sense–as long as the price is right. Luckily, we’ve found one, a low-priced stock that is gushing free cash flow AND buying back shares. Click here to claim your Special Free Report on a fallen angel growth story that is already recovering from a setback.
Operating Margin
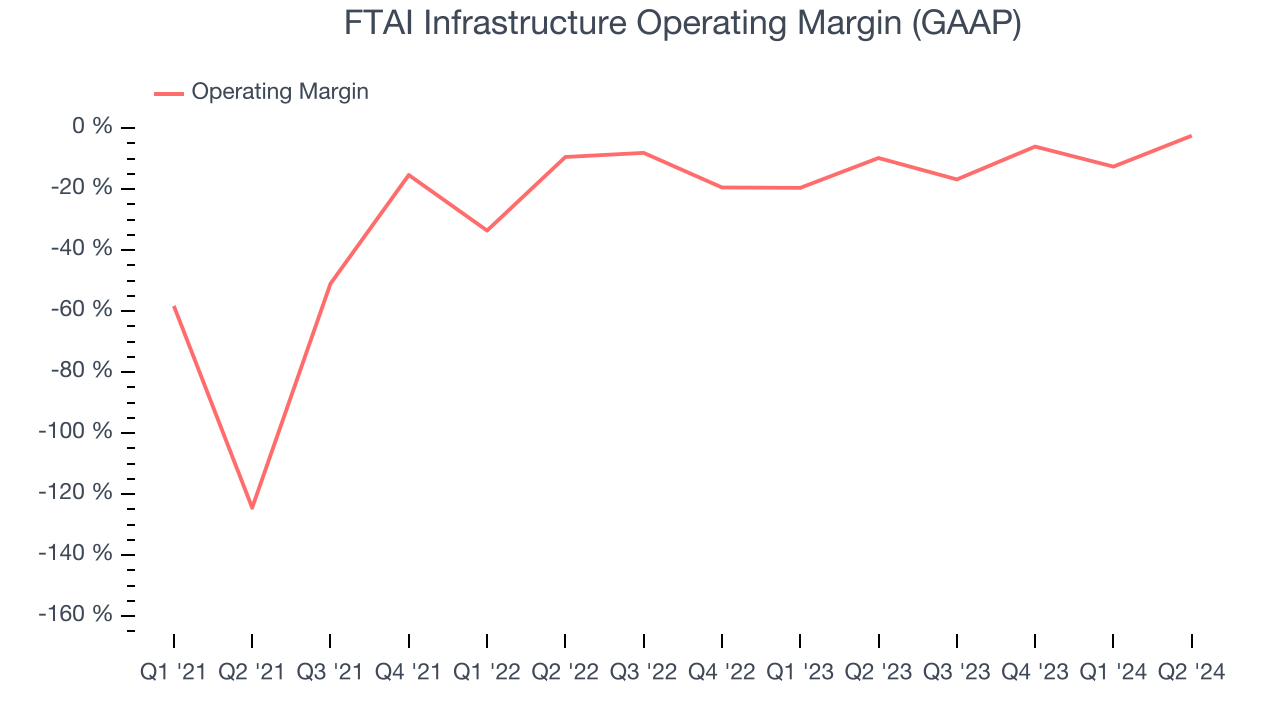
FTAI Infrastructure’s high expenses have contributed to an average operating margin of negative 17.6% over the last four years. Unprofitable industrials companies require extra attention because they could get caught swimming naked when the tide goes out. It’s hard to trust that the business can endure a full cycle.
On the plus side, FTAI Infrastructure’s annual operating margin rose by 79.1 percentage points over the last four years, as its sales growth gave it operating leverage. Still, it will take much more for the company to reach long-term profitability.
Earnings Per Share
We track the change in earnings per share (EPS) for the same reason as long-term revenue growth. Compared to revenue, however, EPS highlights whether a company’s growth was profitable.
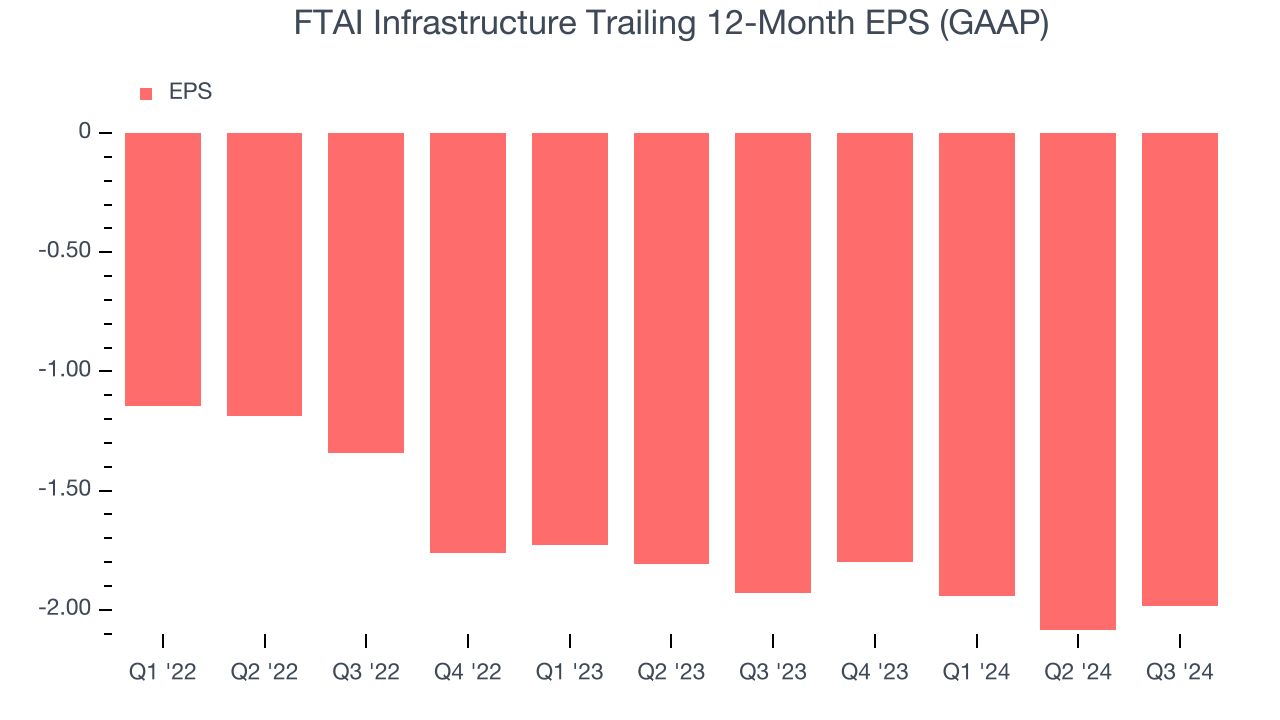
FTAI Infrastructure’s earnings losses deepened over the last two years as its EPS dropped 21.6% annually. We’ll keep a close eye on the company as diminishing earnings could imply changing secular trends and preferences.
In Q3, FTAI Infrastructure reported EPS at negative $0.45, up from negative $0.55 in the same quarter last year. Despite growing year on year, this print missed analysts’ estimates. Over the next 12 months, Wall Street expects FTAI Infrastructure to improve its earnings losses. Analysts forecast its full-year EPS of negative $1.98 will advance to negative $1.00.
Key Takeaways from FTAI Infrastructure’s Q3 Results
We struggled to find many strong positives in these results. Its revenue missed and its EPS fell short of Wall Street’s estimates. Overall, this was a weaker quarter. The stock traded down 5.3% to $8.09 immediately following the results.
FTAI Infrastructure’s latest earnings report disappointed. One quarter doesn’t define a company’s quality, so let’s explore whether the stock is a buy at the current price. We think that the latest quarter is only one piece of the longer-term business quality puzzle. Quality, when combined with valuation, can help determine if the stock is a buy. We cover that in our actionable full research report which you can read here, it’s free.


