American restaurant chain BJ’s Restaurants (NASDAQ: BJRI) met Wall Street’s revenue expectations in Q3 CY2024, with sales up 2.2% year on year to $325.7 million. Its GAAP loss of $0.13 per share was 587% below analysts’ consensus estimates.
Is now the time to buy BJ's? Find out by accessing our full research report, it’s free.
BJ's (BJRI) Q3 CY2024 Highlights:
- Revenue: $325.7 million vs analyst estimates of $325 million (in line)
- EPS: -$0.13 vs analyst estimates of $0.03 (-$0.16 miss)
- EBITDA: $18.51 million vs analyst estimates of $22.65 million (18.3% miss)
- Gross Margin (GAAP): 11.7%, in line with the same quarter last year
- Operating Margin: -0.8%, in line with the same quarter last year
- EBITDA Margin: 5.7%, in line with the same quarter last year
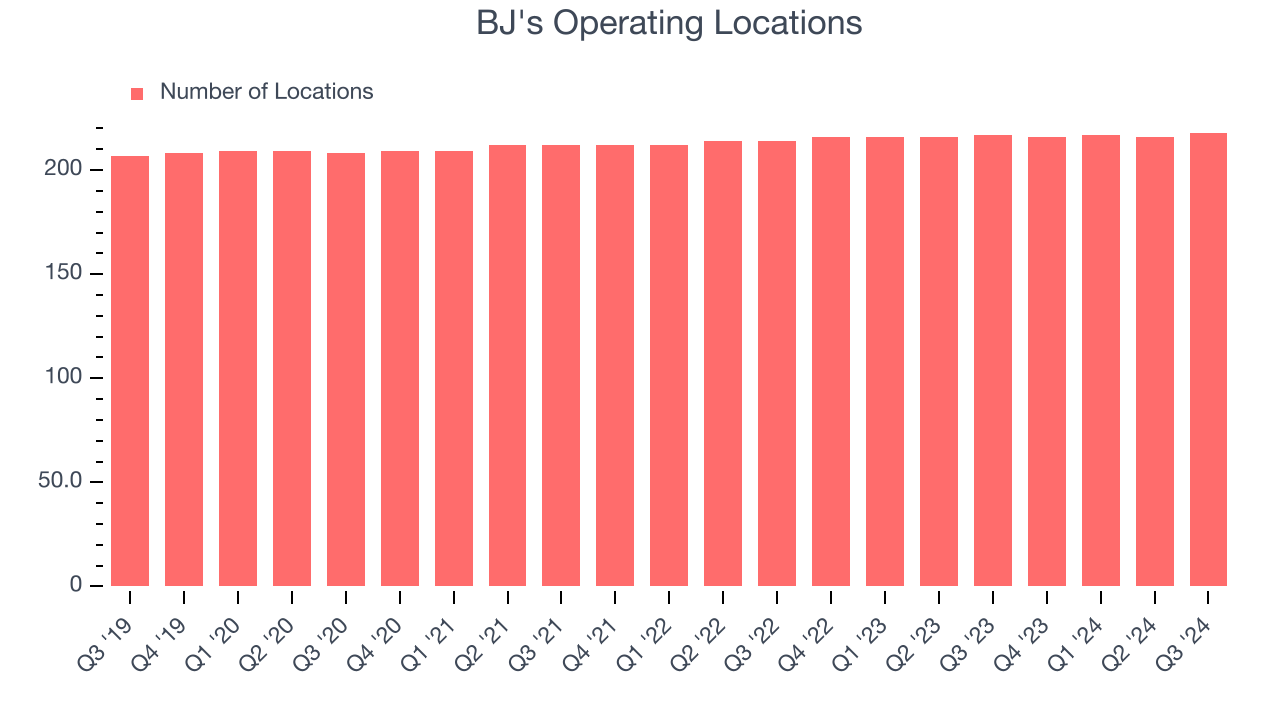
- Locations: 218 at quarter end, up from 217 in the same quarter last year
- Same-Store Sales rose 1.7% year on year (0.4% in the same quarter last year)
- Market Capitalization: $866.9 million
“Our third quarter results mark progress with our sales building initiatives, which drove positive comparable restaurant sales and guest traffic that accelerated through the quarter,” commented Brad Richmond, Interim Chief Executive Officer.
Company Overview
Founded in 1978 in California, BJ’s Restaurants (NASDAQ: BJRI) is a chain of restaurants whose menu features classic American dishes, often with a twist.
Sit-Down Dining
Sit-down restaurants offer a complete dining experience with table service. These establishments span various cuisines and are renowned for their warm hospitality and welcoming ambiance, making them perfect for family gatherings, special occasions, or simply unwinding. Their extensive menus range from appetizers to indulgent desserts and wines and cocktails. This space is extremely fragmented and competition includes everything from publicly-traded companies owning multiple chains to single-location mom-and-pop restaurants.
Sales Growth
A company’s long-term performance can give signals about its business quality. Even a bad business can shine for one or two quarters, but a top-tier one grows for years.
BJ's is a mid-sized restaurant chain, which sometimes brings disadvantages compared to larger competitors benefiting from better brand awareness and economies of scale.
As you can see below, BJ’s sales grew at a sluggish 3% compounded annual growth rate over the last five years (we compare to 2019 to normalize for COVID-19 impacts) as its restaurant footprint remained unchanged.
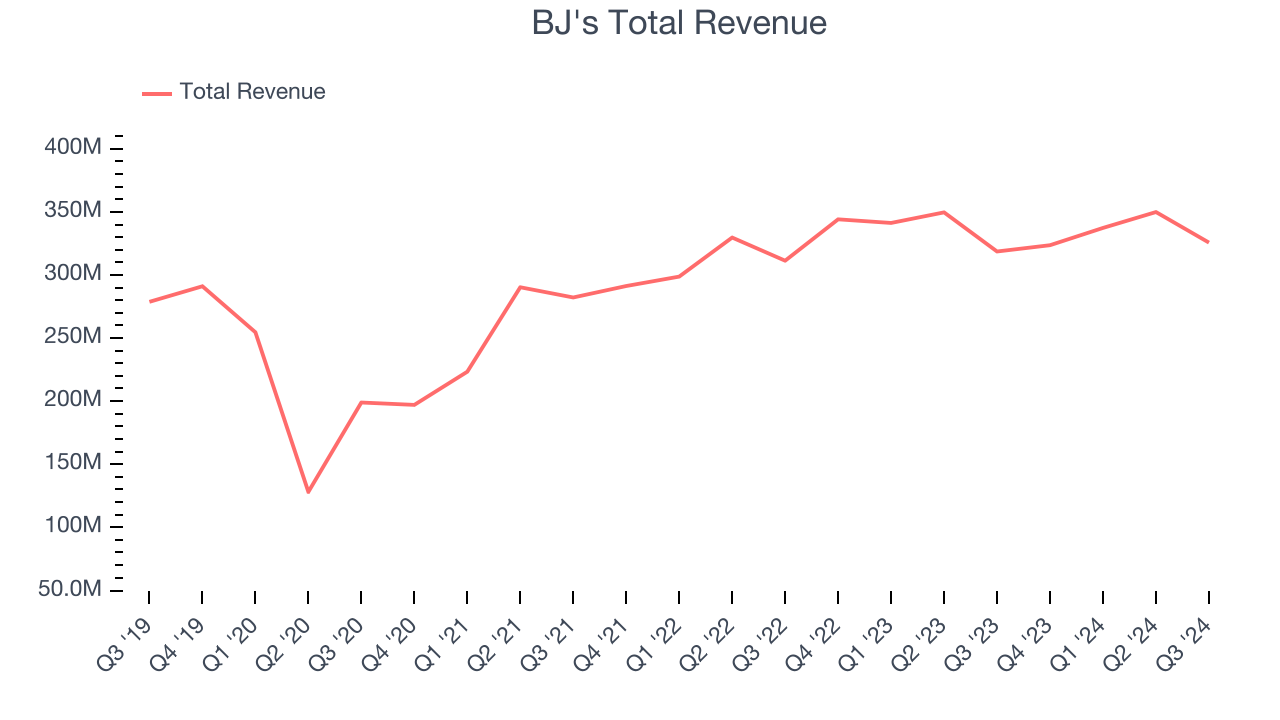
This quarter, BJ's grew its revenue by 2.2% year on year, and its $325.7 million of revenue was in line with Wall Street’s estimates.
Looking ahead, sell-side analysts expect revenue to grow 2.5% over the next 12 months, similar to its five-year rate. This projection is underwhelming and indicates the market believes its newer offerings will not accelerate its top-line performance yet.
Here at StockStory, we certainly understand the potential of thematic investing. Diverse winners from Microsoft (MSFT) to Alphabet (GOOG), Coca-Cola (KO) to Monster Beverage (MNST) could all have been identified as promising growth stories with a megatrend driving the growth. So, in that spirit, we’ve identified a relatively under-the-radar profitable growth stock benefitting from the rise of AI, available to you FREE via this link.
Restaurant Performance
Number of Restaurants
BJ's operated 218 locations in the latest quarter, and over the last two years, has kept its restaurant count flat while other restaurant businesses have opted for growth.
When a chain doesn’t open many new restaurants, it usually means there’s stable demand for its meals and it’s focused on improving operational efficiency to increase profitability.
Same-Store Sales
A company's restaurant base only paints one part of the picture. When demand is high, it makes sense to open more. But when demand is low, it’s prudent to close some locations and use the money in other ways. Same-store sales is an industry measure of whether revenue is growing at those existing restaurants and is driven by customer visits (often called traffic) and the average spending per customer (ticket).
BJ’s demand rose over the last two years and slightly outpaced the industry. On average, the company’s same-store sales have grown by 2.6% per year. Given its flat restaurant base over the same period, this performance stems from a mixture of higher prices and increased foot traffic at existing locations.
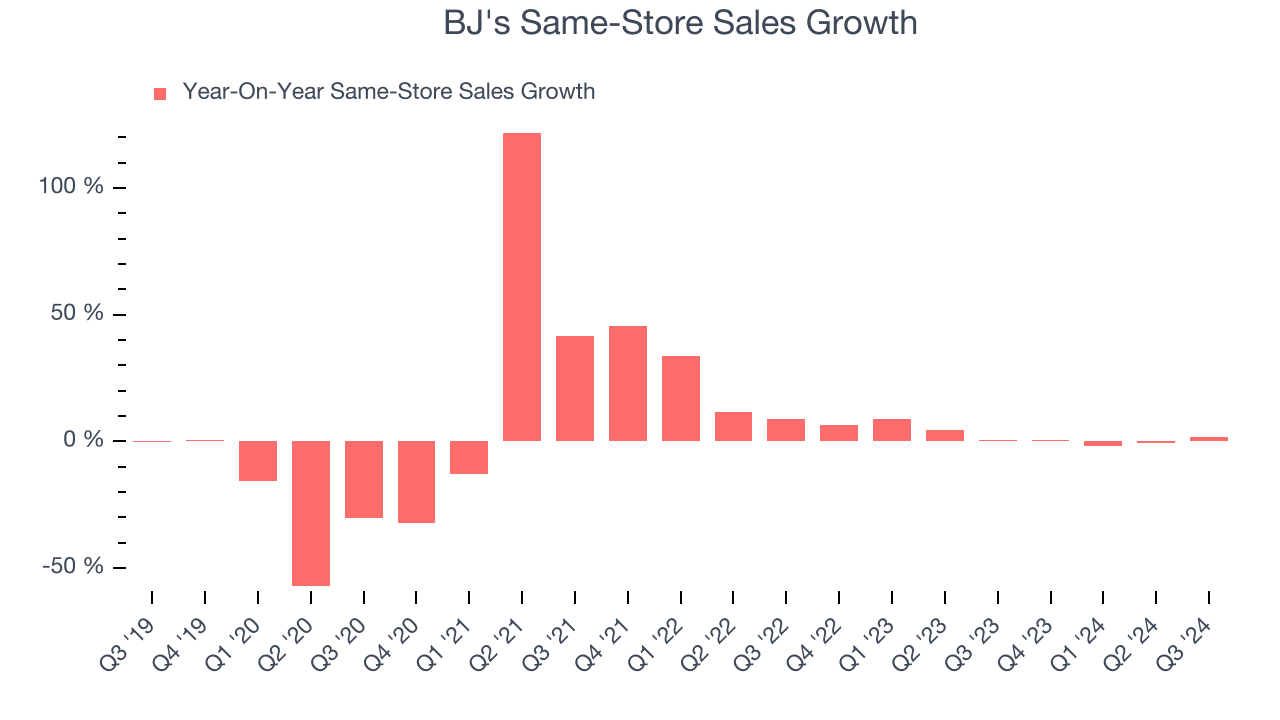
In the latest quarter, BJ’s same-store sales rose 1.7% annually. This growth was an acceleration from the 0.4% year-on-year increase it posted 12 months ago, which is always an encouraging sign.
Key Takeaways from BJ’s Q3 Results
We struggled to find many strong positives in these results. Its EBITDA missed and its EPS missed Wall Street’s estimates. Overall, this was a weaker quarter. The stock traded down 5.6% to $34.99 immediately after reporting.
BJ's underperformed this quarter, but does that create an opportunity to invest right now? When making that decision, it’s important to consider its valuation, business qualities, as well as what has happened in the latest quarter. We cover that in our actionable full research report which you can read here, it’s free.


