Traffic solutions company Verra Mobility (NYSE: VRRM) met Wall Street’s revenue expectations in Q3 CY2024, with sales up 7.4% year on year to $225.6 million. On the other hand, the company’s full-year revenue guidance of $872.5 million at the midpoint came in slightly below analysts’ estimates. Its non-GAAP profit of $0.32 per share was 1.4% above analysts’ consensus estimates.
Is now the time to buy Verra Mobility? Find out by accessing our full research report, it’s free.
Verra Mobility (VRRM) Q3 CY2024 Highlights:
- Revenue: $225.6 million vs analyst estimates of $226.6 million (in line)
- Adjusted EPS: $0.32 vs analyst estimates of $0.32 (beat by $0)
- EBITDA: $104.7 million vs analyst estimates of $106.3 million (1.5% miss)
- The company reconfirmed its revenue guidance for the full year of $872.5 million at the midpoint
- Management reiterated its full-year Adjusted EPS guidance of $1.17 at the midpoint
- EBITDA guidance for the full year is $400 million at the midpoint, below analyst estimates of $404.5 million
- Operating Margin: 28.3%, in line with the same quarter last year
- EBITDA Margin: 46.4%, in line with the same quarter last year
- Free Cash Flow Margin: 37.7%, up from 24.8% in the same quarter last year
- Market Capitalization: $4.33 billion
"We delivered a solid third quarter, highlighted by strong revenue, earnings, and cash flow generation," said David Roberts, President and CEO, Verra Mobility.
Company Overview
Managing over 165 million tolling transactions per year, Verra Mobility (NYSE: VRRM) is a leading provider of smart mobility technology that enhances safety, efficiency, and convenience on roadways.
Electrical Systems
Like many equipment and component manufacturers, electrical systems companies are buoyed by secular trends such as connectivity and industrial automation. More specific pockets of strong demand include Internet of Things (IoT) connectivity and the 5G telecom upgrade cycle, which can benefit companies whose cables and conduits fit those needs. But like the broader industrials sector, these companies are also at the whim of economic cycles. Interest rates, for example, can greatly impact projects that drive demand for these products.
Sales Growth
Examining a company’s long-term performance can provide clues about its business quality. Any business can put up a good quarter or two, but the best consistently grow over the long haul. Over the last five years, Verra Mobility grew its sales at an incredible 15% compounded annual growth rate. This is a great starting point for our analysis because it shows Verra Mobility’s offerings resonate with customers.
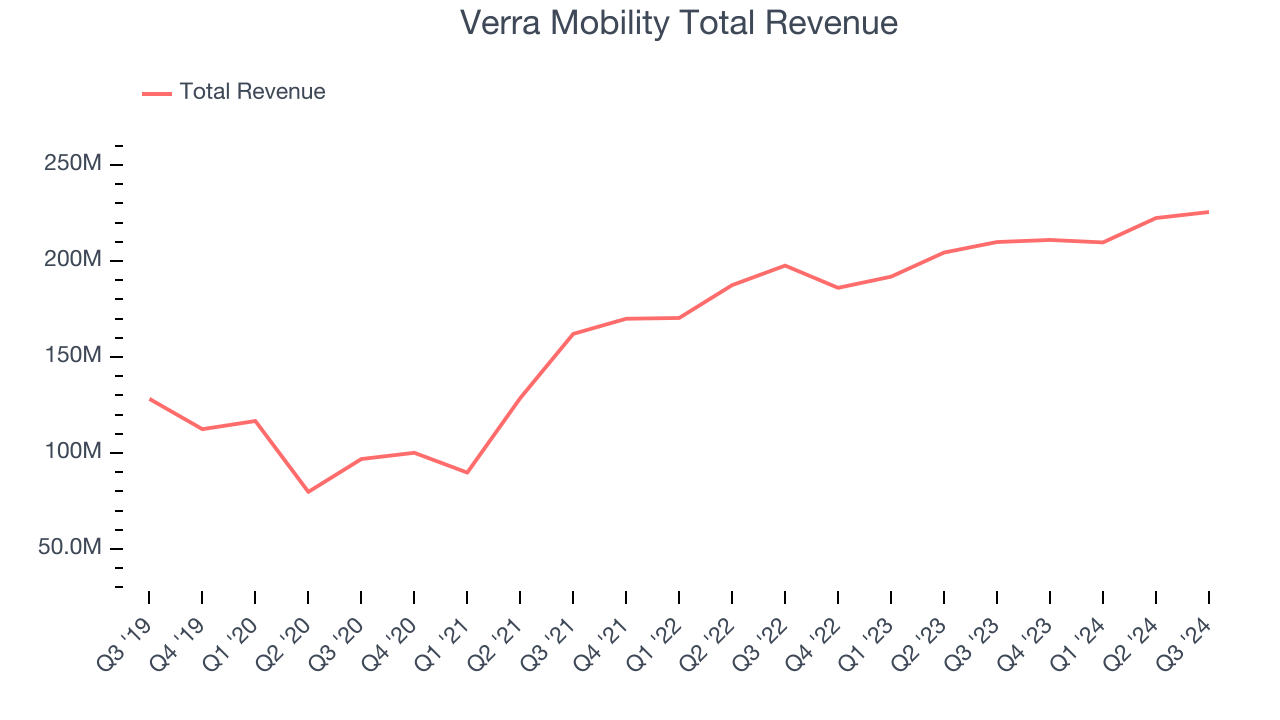
We at StockStory place the most emphasis on long-term growth, but within industrials, a half-decade historical view may miss cycles, industry trends, or a company capitalizing on catalysts such as a new contract win or a successful product line. Verra Mobility’s annualized revenue growth of 9.4% over the last two years is below its five-year trend, but we still think the results were good and suggest demand was strong. Verra Mobility’s recent history shows it’s one of the better Electrical Systems businesses as many of its peers faced declining sales because of cyclical headwinds. 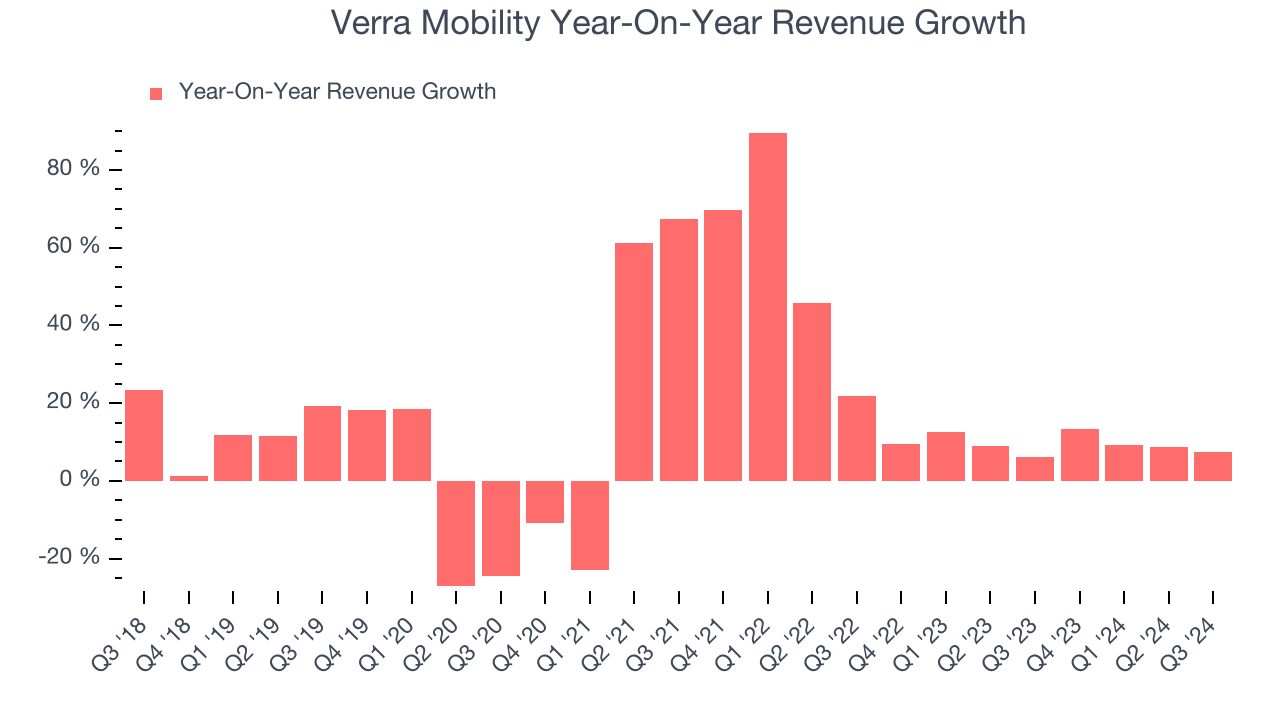
This quarter, Verra Mobility grew its revenue by 7.4% year on year, and its $225.6 million of revenue was in line with Wall Street’s estimates.
Looking ahead, sell-side analysts expect revenue to grow 7.1% over the next 12 months, a slight deceleration versus the last two years. This projection doesn't excite us and shows the market thinks its products and services will face some demand challenges. At least the company is tracking well in other measures of financial health.
Here at StockStory, we certainly understand the potential of thematic investing. Diverse winners from Microsoft (MSFT) to Alphabet (GOOG), Coca-Cola (KO) to Monster Beverage (MNST) could all have been identified as promising growth stories with a megatrend driving the growth. So, in that spirit, we’ve identified a relatively under-the-radar profitable growth stock benefitting from the rise of AI, available to you FREE via this link.
Operating Margin
Operating margin is an important measure of profitability as it shows the portion of revenue left after accounting for all core expenses–everything from the cost of goods sold to advertising and wages. It’s also useful for comparing profitability across companies with different levels of debt and tax rates because it excludes interest and taxes.
Verra Mobility has been a well-oiled machine over the last five years. It demonstrated elite profitability for an industrials business, boasting an average operating margin of 21.6%. This result isn’t surprising as its high gross margin gives it a favorable starting point.
Analyzing the trend in its profitability, Verra Mobility’s annual operating margin rose by 10.5 percentage points over the last five years, as its sales growth gave it immense operating leverage.
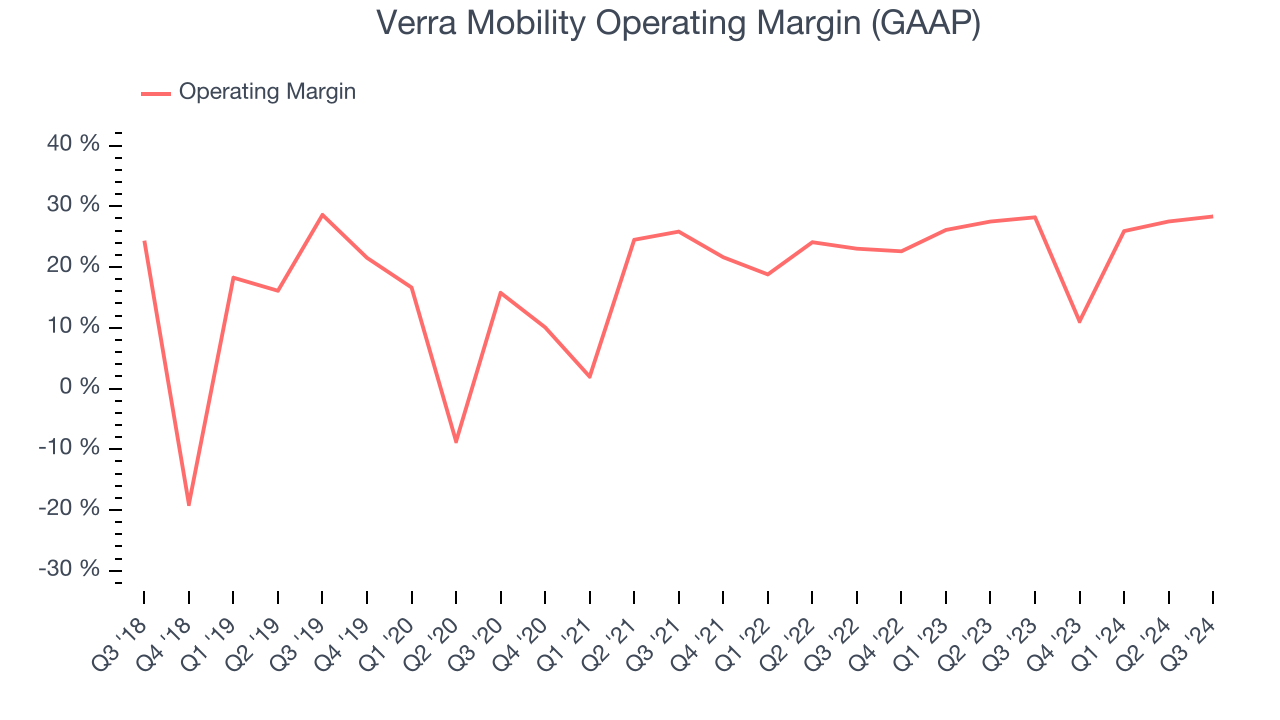
This quarter, Verra Mobility generated an operating profit margin of 28.3%, in line with the same quarter last year. This indicates the company’s cost structure has recently been stable.
Earnings Per Share
We track the long-term change in earnings per share (EPS) for the same reason as long-term revenue growth. Compared to revenue, however, EPS highlights whether a company’s growth was profitable.
Verra Mobility’s EPS grew at a remarkable 12% compounded annual growth rate over the last five years. Despite its operating margin expansion during that time, this performance was lower than its 15% annualized revenue growth. This tells us that non-fundamental factors affected its ultimate earnings.
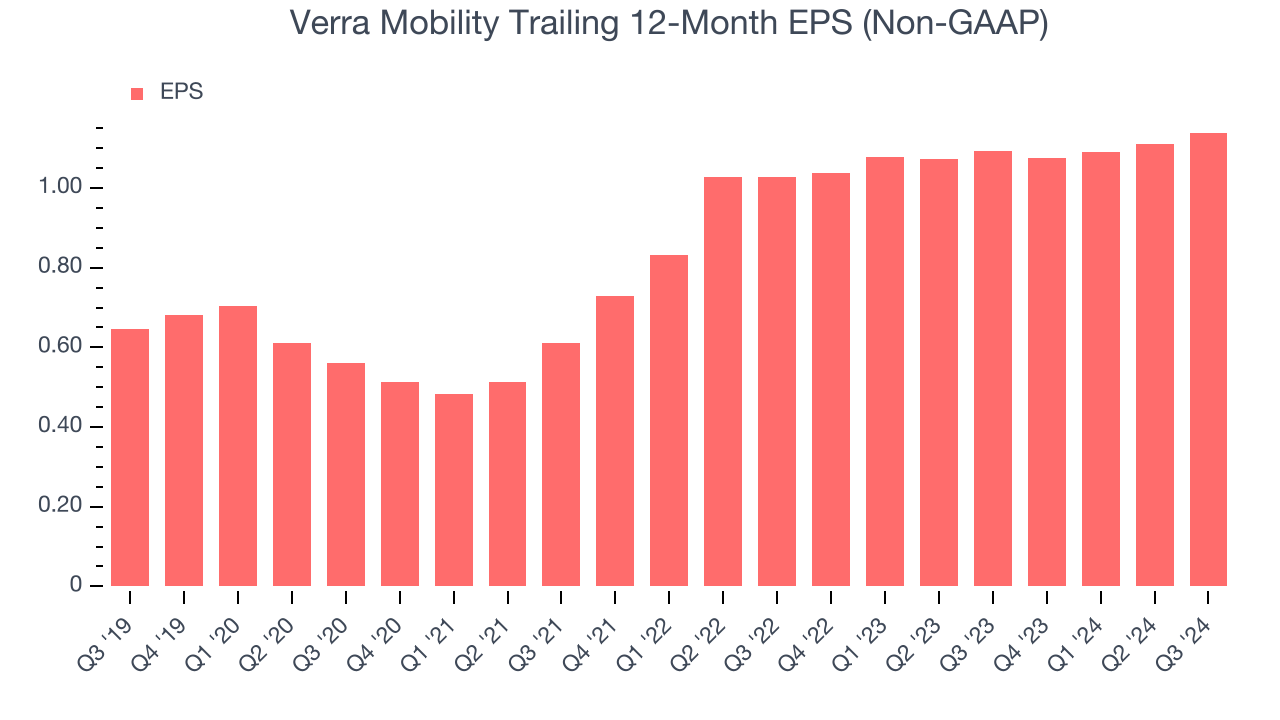
We can take a deeper look into Verra Mobility’s earnings to better understand the drivers of its performance. A five-year view shows Verra Mobility has diluted its shareholders, growing its share count by 2.4%. This dilution overshadowed its increased operating efficiency and has led to lower per share earnings. Taxes and interest expenses can also affect EPS but don’t tell us as much about a company’s fundamentals. 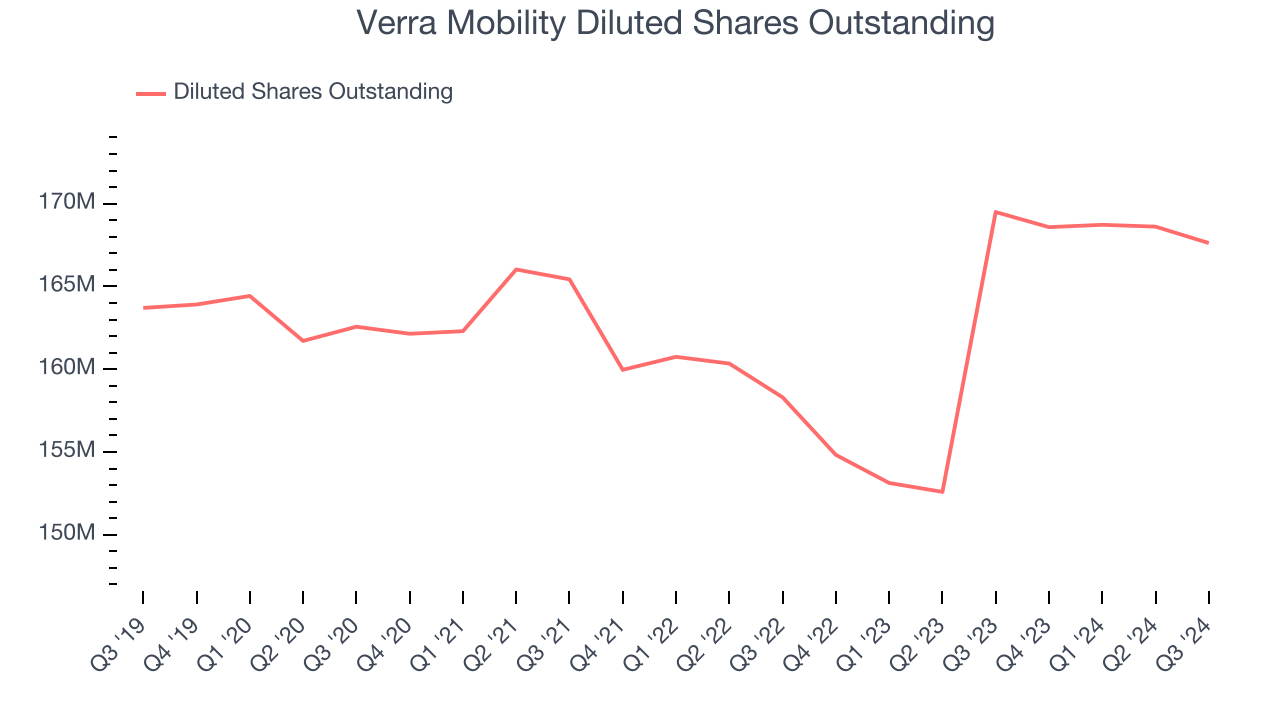
Like with revenue, we analyze EPS over a more recent period because it can give insight into an emerging theme or development for the business.
For Verra Mobility, its two-year annual EPS growth of 5.3% was lower than its five-year trend. This wasn’t great, but at least the company was successful in other measures of financial health.In Q3, Verra Mobility reported EPS at $0.32, up from $0.29 in the same quarter last year. This print beat analysts’ estimates by 1.4%. Over the next 12 months, Wall Street expects Verra Mobility’s full-year EPS of $1.14 to grow by 16.7%.
Key Takeaways from Verra Mobility’s Q3 Results
We struggled to find many strong positives in these results. Its full-year EBITDA forecast was underwhelming and its EBITDA fell short of Wall Street’s estimates. Overall, this quarter could have been better. The stock traded down 1.8% to $25.50 immediately following the results.
The latest quarter from Verra Mobility’s wasn’t that good. One earnings report doesn’t define a company’s quality, though, so let’s explore whether the stock is a buy at the current price. When making that decision, it’s important to consider its valuation, business qualities, as well as what has happened in the latest quarter. We cover that in our actionable full research report which you can read here, it’s free.