Home services online marketplace ANGI (NASDAQ: ANGI) met Wall Street’s revenue expectations in Q3 CY2024, but sales fell 15.5% year on year to $296.7 million. Its GAAP profit of $0.07 per share was 5,363% above analysts’ consensus estimates.
Is now the time to buy Angi? Find out by accessing our full research report, it’s free.
Angi (ANGI) Q3 CY2024 Highlights:
- Revenue: $296.7 million vs analyst estimates of $296.3 million (in line)
- EPS: $0.07 vs analyst estimates of $0 ($0.07 beat)
- EBITDA: $35.4 million vs analyst estimates of $32.94 million (7.5% beat)
- EBITDA guidance for the full year is $142.5 million at the midpoint, in line with analyst expectations
- Gross Margin (GAAP): 95%, up from 91.8% in the same quarter last year
- Operating Margin: 2.6%, up from -2.9% in the same quarter last year
- EBITDA Margin: 11.9%, up from 7.9% in the same quarter last year
- Service Requests: 4.49 million, down 1.58 million year on year
- Market Capitalization: $1.25 billion
Company Overview
Created by IAC’s mergers of Angie’s List and HomeAdvisor, ANGI (NASDAQ: ANGI) operates the largest online marketplace for home services in the US.
Gig Economy
The iPhone changed the world, ushering in the era of the “always-on” internet and “on-demand” services - anything someone could want is just a few taps away. Likewise, the gig economy sprang up in a similar fashion, with a proliferation of tech-enabled freelance labor marketplaces, which work hand and hand with many on demand services. Individuals can now work on demand too. What began with tech-enabled platforms that aggregated riders and drivers has expanded over the past decade to include food delivery, groceries, and now even a plumber or graphic designer are all just a few taps away.
Sales Growth
A company’s long-term performance can indicate its business quality. Any business can put up a good quarter or two, but many enduring ones grow for years. Over the last three years, Angi’s revenue declined by 6.8% per year. This shows demand was weak, a rough starting point for our analysis.
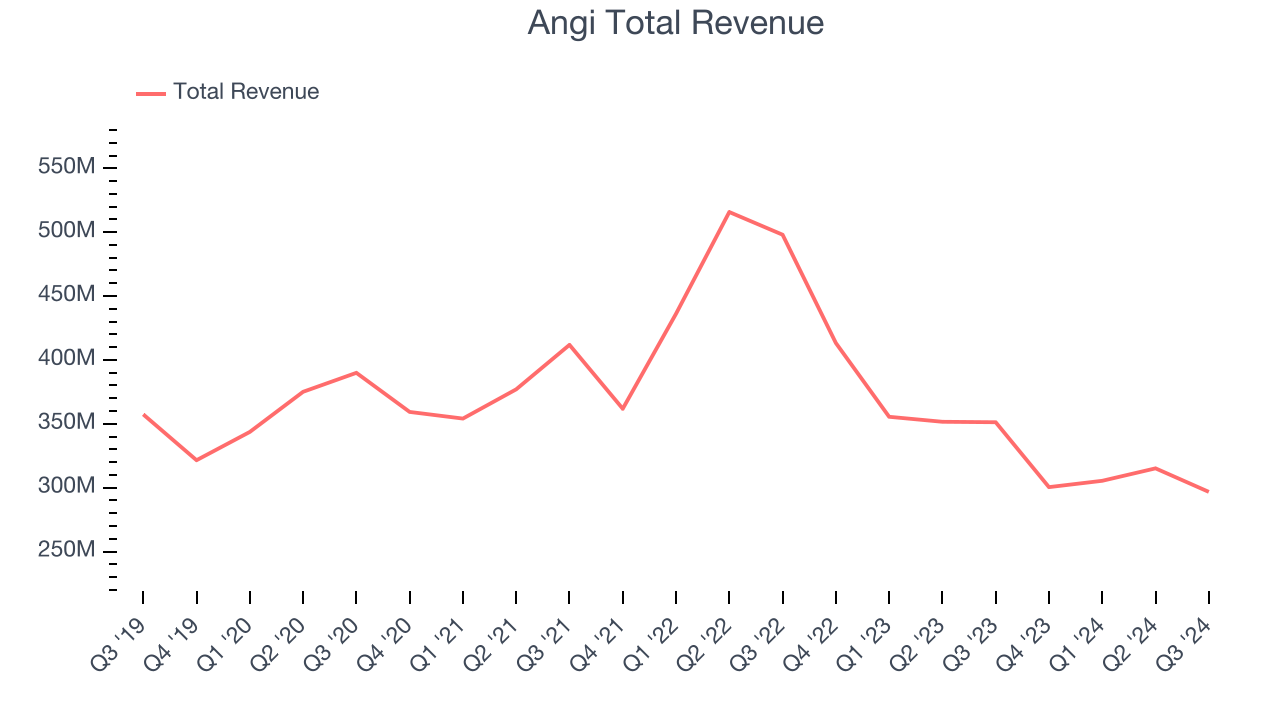
This quarter, Angi reported a rather uninspiring 15.5% year-on-year revenue decline to $296.7 million of revenue, in line with Wall Street’s estimates.
Looking ahead, sell-side analysts expect revenue to decline 3.3% over the next 12 months. Although this projection is better than its three-year trend, it's hard to get excited about a company that is struggling with demand.
When a company has more cash than it knows what to do with, buying back its own shares can make a lot of sense–as long as the price is right. Luckily, we’ve found one, a low-priced stock that is gushing free cash flow AND buying back shares. Click here to claim your Special Free Report on a fallen angel growth story that is already recovering from a setback.
Service Requests
Request Growth
As a gig economy marketplace, Angi generates revenue growth by expanding the number of services on its platform (e.g. rides, deliveries, freelance jobs) and raising the commission fee from each service provided.
Angi struggled to engage its service requests over the last two years as they have declined by 22.9% annually to 4.49 million in the latest quarter. This performance isn't ideal because internet usage is secular. If Angi wants to accelerate growth, it must enhance the appeal of its current offerings or innovate with new products. 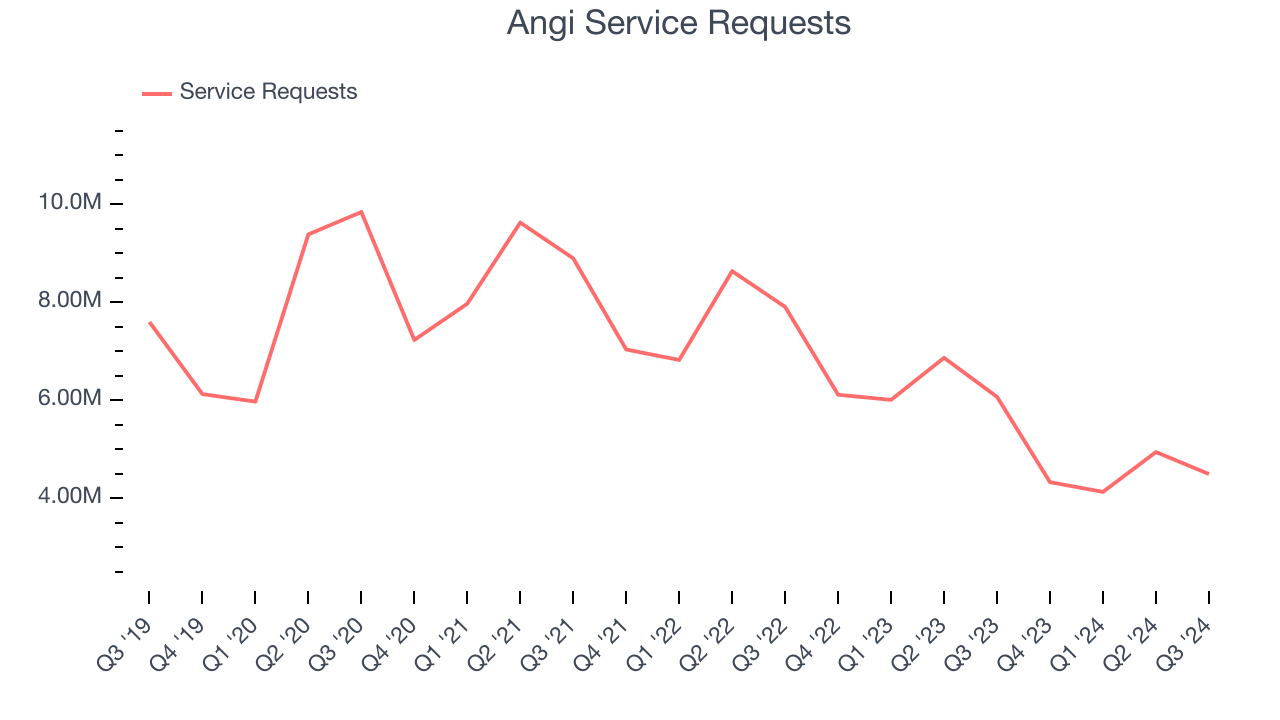
In Q3, Angi’s service requests once again decreased by 1.58 million, a 26% drop since last year. The quarterly print was lower than its two-year result, suggesting its new initiatives aren’t moving the needle for requests yet.
Revenue Per Request
Average revenue per request (ARPR) is a critical metric to track for consumer internet businesses like Angi because it measures how much the company earns in transaction fees from each request. This number also informs us about Angi’s take rate, which represents its pricing leverage over the ecosystem, or "cut" from each transaction.
Angi’s ARPR growth has been impressive over the last two years, averaging 8.5%. Although its service requests shrank during this time, the company’s ability to successfully increase monetization demonstrates its platform’s value for existing requests. 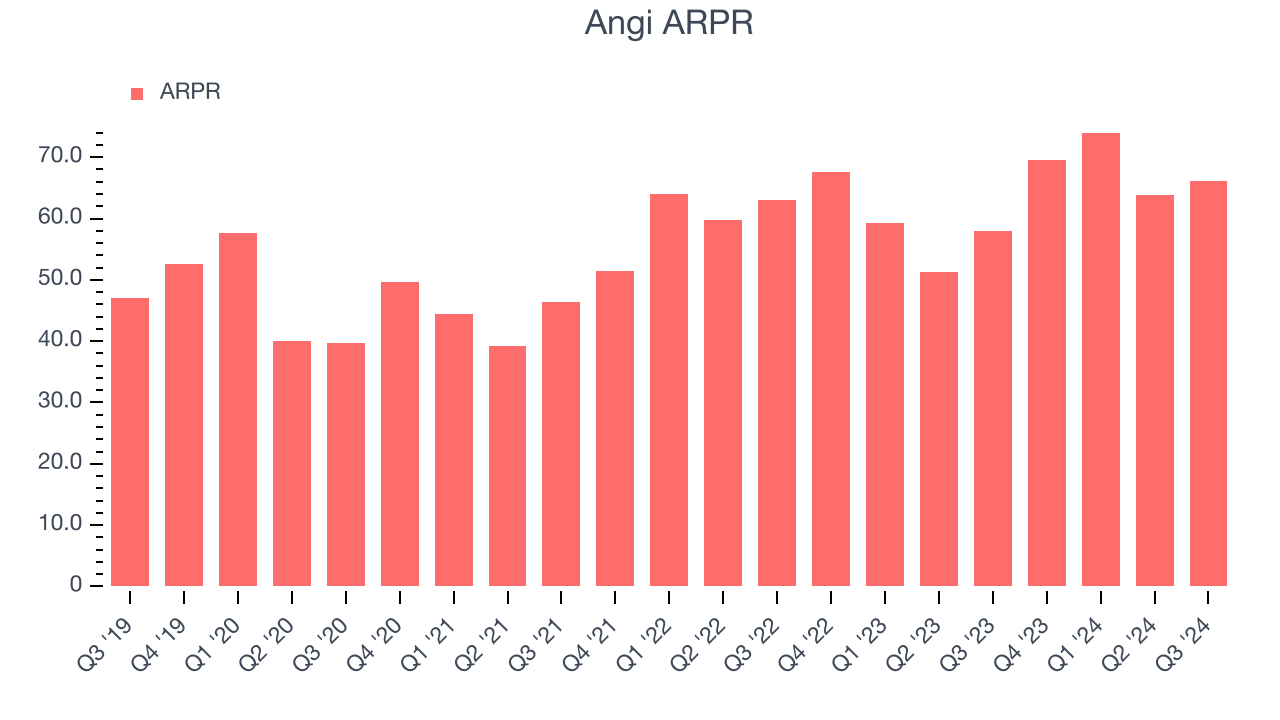
This quarter, Angi’s ARPR clocked in at $66.08. It grew 14.1% year on year, faster than its service requests.
Key Takeaways from Angi’s Q3 Results
We were impressed by how significantly Angi blew past analysts’ EBITDA expectations this quarter. We were also glad its full-year EBITDA guidance exceeded Wall Street’s estimates. On the other hand, its number of requests declined and its requests fell short of Wall Street’s estimates. Overall, this was a weaker quarter. The stock traded down 4.2% to $2.52 immediately following the results.
The latest quarter from Angi’s wasn’t that good. One earnings report doesn’t define a company’s quality, though, so let’s explore whether the stock is a buy at the current price. We think that the latest quarter is only one piece of the longer-term business quality puzzle. Quality, when combined with valuation, can help determine if the stock is a buy. We cover that in our actionable full research report which you can read here, it’s free.