
Wrapping up Q3 earnings, we look at the numbers and key takeaways for the industrial packaging stocks, including Silgan Holdings (NYSE: SLGN) and its peers.
Industrial packaging companies have built competitive advantages from economies of scale that lead to advantaged purchasing and capital investments that are difficult and expensive to replicate. Recently, eco-friendly packaging and conservation are driving customers preferences and innovation. For example, plastic is not as desirable a material as it once was. Despite being integral to consumer goods ranging from beer to toothpaste to laundry detergent, these companies are still at the whim of the macro, especially consumer health and consumer willingness to spend.
The 8 industrial packaging stocks we track reported a mixed Q3. As a group, revenues missed analysts’ consensus estimates by 0.6%.
In light of this news, share prices of the companies have held steady as they are up 2.6% on average since the latest earnings results.
Weakest Q3: Silgan Holdings (NYSE: SLGN)
Established in 1987, Silgan Holdings (NYSE: SLGN) is a supplier of rigid packaging for consumer goods products, specializing in metal containers, closures, and plastic packaging.
Silgan Holdings reported revenues of $1.75 billion, down 3.2% year on year. This print fell short of analysts’ expectations by 4.6%. Overall, it was a disappointing quarter for the company with a miss of analysts’ EBITDA estimates.
"Our third quarter results continued to benefit from the success of our long-term strategic growth initiatives, the power of the Silgan portfolio and the strength and agility of our operating teams," said Adam Greenlee, President and CEO.
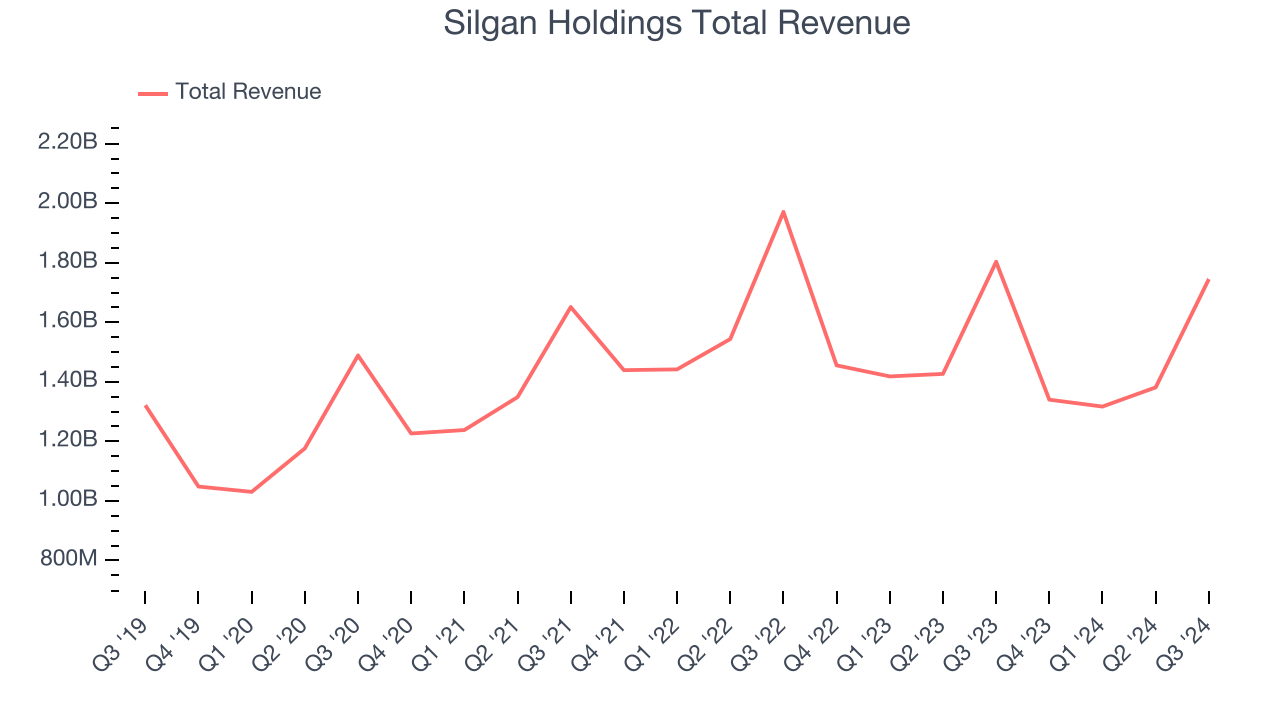
Silgan Holdings delivered the weakest performance against analyst estimates of the whole group. Interestingly, the stock is up 6.4% since reporting and currently trades at $54.07.
Read our full report on Silgan Holdings here, it’s free.
Best Q3: International Paper (NYSE: IP)
Established in 1898, International Paper (NYSE: IP) produces containerboard, pulp, paper, and materials used in packaging and printing applications.
International Paper reported revenues of $4.69 billion, up 1.6% year on year, in line with analysts’ expectations. The business had an exceptional quarter with an impressive beat of analysts’ earnings and EBITDA estimates.
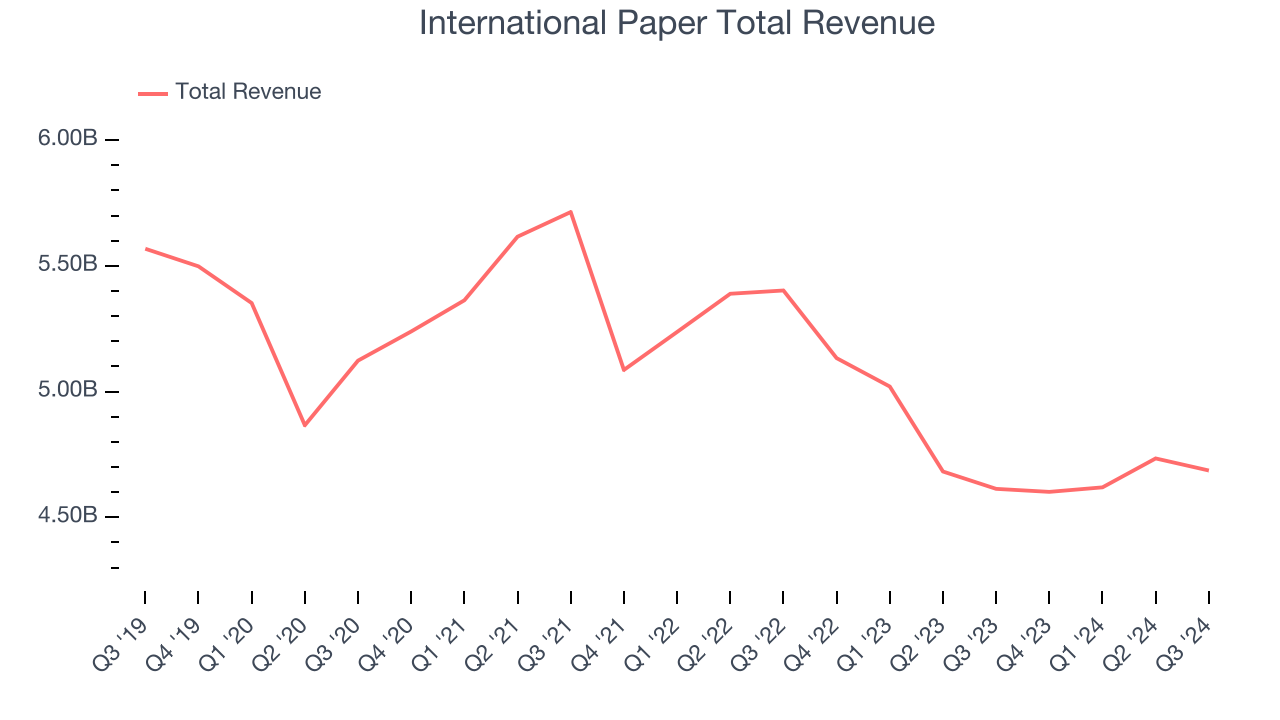
The market seems happy with the results as the stock is up 16.4% since reporting. It currently trades at $57.10.
Is now the time to buy International Paper? Access our full analysis of the earnings results here, it’s free.
Graphic Packaging Holding (NYSE: GPK)
Founded in 1991, Graphic Packaging (NYSE: GPK) is a provider of paper-based packaging solutions for a wide range of products.
Graphic Packaging Holding reported revenues of $2.22 billion, down 5.7% year on year, falling short of analysts’ expectations by 2.8%. It was a softer quarter as it posted a miss of analysts’ earnings and volume estimates.
As expected, the stock is down 2.4% since the results and currently trades at $29.61.
Read our full analysis of Graphic Packaging Holding’s results here.
Ball (NYSE: BALL)
Started with a $200 loan in 1880, Ball (NYSE: BLL) manufactures aluminum packaging for beverages, personal care, and household products as well as aerospace systems and other technologies.
Ball reported revenues of $3.08 billion, down 13.7% year on year. This number lagged analysts' expectations by 1.6%. Overall, it was a slower quarter as it also recorded a miss of analysts’ organic revenue estimates.
Ball had the slowest revenue growth among its peers. The stock is down 6.1% since reporting and currently trades at $60.31.
Read our full, actionable report on Ball here, it’s free.
Packaging Corporation of America (NYSE: PKG)
Founded in 1959, Packaging Corporation of America (NYSE: PKG) produces containerboard and corrugated packaging products, also offering displays and protective packaging solutions.
Packaging Corporation of America reported revenues of $2.18 billion, up 12.7% year on year. This number surpassed analysts’ expectations by 4.4%. Overall, it was an exceptional quarter as it also produced an impressive beat of analysts’ volume estimates and a solid beat of analysts’ operating margin estimates.
Packaging Corporation of America achieved the biggest analyst estimates beat and fastest revenue growth among its peers. The stock is up 12.2% since reporting and currently trades at $243.01.
Read our full, actionable report on Packaging Corporation of America here, it’s free.
Market Update
As expected, the Federal Reserve cut its policy rate by 25bps (a quarter of a percent) in November 2024 after Donald Trump triumphed in the US Presidential election. This marks the central bank's second easing of monetary policy after a large 50bps rate cut two months earlier. Going forward, the markets will debate whether these rate cuts (and more potential ones in 2025) are perfect timing to support the economy or a bit too late for a macro that has already cooled too much. Adding to the degree of difficulty is a new Republican administration that could make large changes to corporate taxes and prior efforts such as the Inflation Reduction Act.
Want to invest in winners with rock-solid fundamentals? Check out our Top 5 Growth Stocks and add them to your watchlist. These companies are poised for growth regardless of the political or macroeconomic climate.
Join Paid Stock Investor Research
Help us make StockStory more helpful to investors like yourself. Join our paid user research session and receive a $50 Amazon gift card for your opinions. Sign up here.


