
The past six months have been a windfall for RH’s shareholders. The company’s stock price has jumped 55.8%, hitting $390.43 per share. This was partly due to its solid quarterly results, and the run-up might have investors contemplating their next move.
Is now the time to buy RH, or should you be careful about including it in your portfolio? See what our analysts have to say in our full research report, it’s free.Despite the momentum, we're cautious about RH. Here are three reasons why we avoid RH and a stock we'd rather own.
Why Is RH Not Exciting?
Formerly known as Restoration Hardware, RH (NYSE: RH) is a specialty retailer that exclusively sells its own brand of of high-end furniture and home decor.
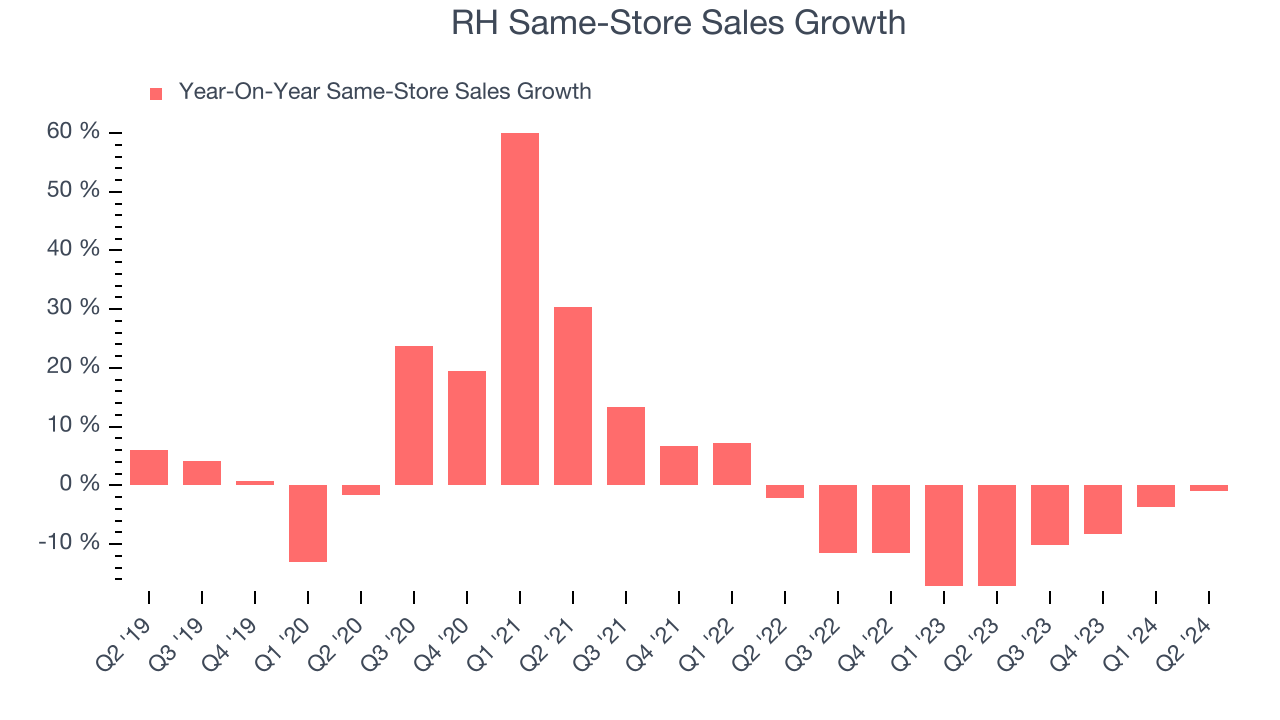
1. Declining Same-Store Sales Indicate Evaporating Demand
Same-store sales show the change in sales for a retailer's e-commerce platform and brick-and-mortar shops that have existed for at least a year. This is a key performance indicator because it measures organic growth.
RH’s demand has been shrinking over the last two years as its same-store sales have averaged 10.1% annual declines.
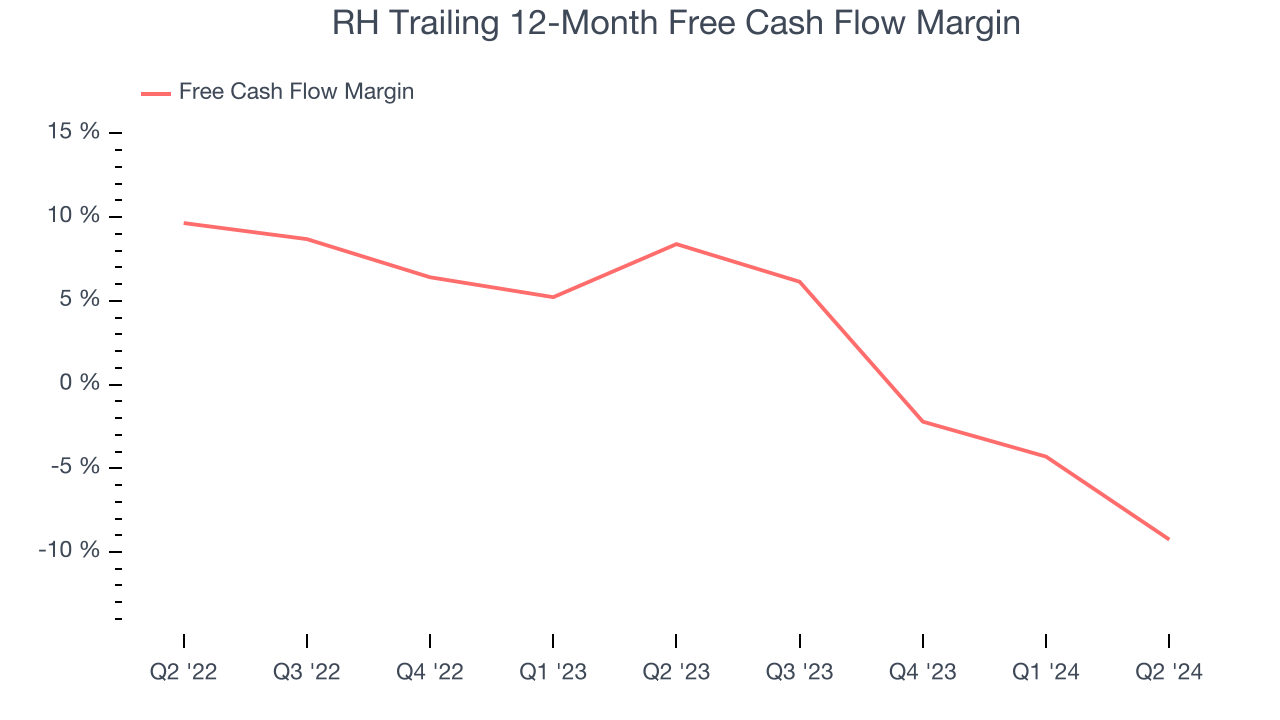
2. Free Cash Flow Margin Dropping
If you’ve followed StockStory for a while, you know we emphasize free cash flow. Why, you ask? We believe that in the end, cash is king, and you can’t use accounting profits to pay the bills.
As you can see below, RH’s margin dropped by 17.6 percentage points over the last year. This decrease warrants extra caution because RH failed to grow its same-store sales. Its cash profitability could decay further if it tries to reignite growth by opening new stores. RH’s free cash flow margin for the trailing 12 months was negative 9.3%.
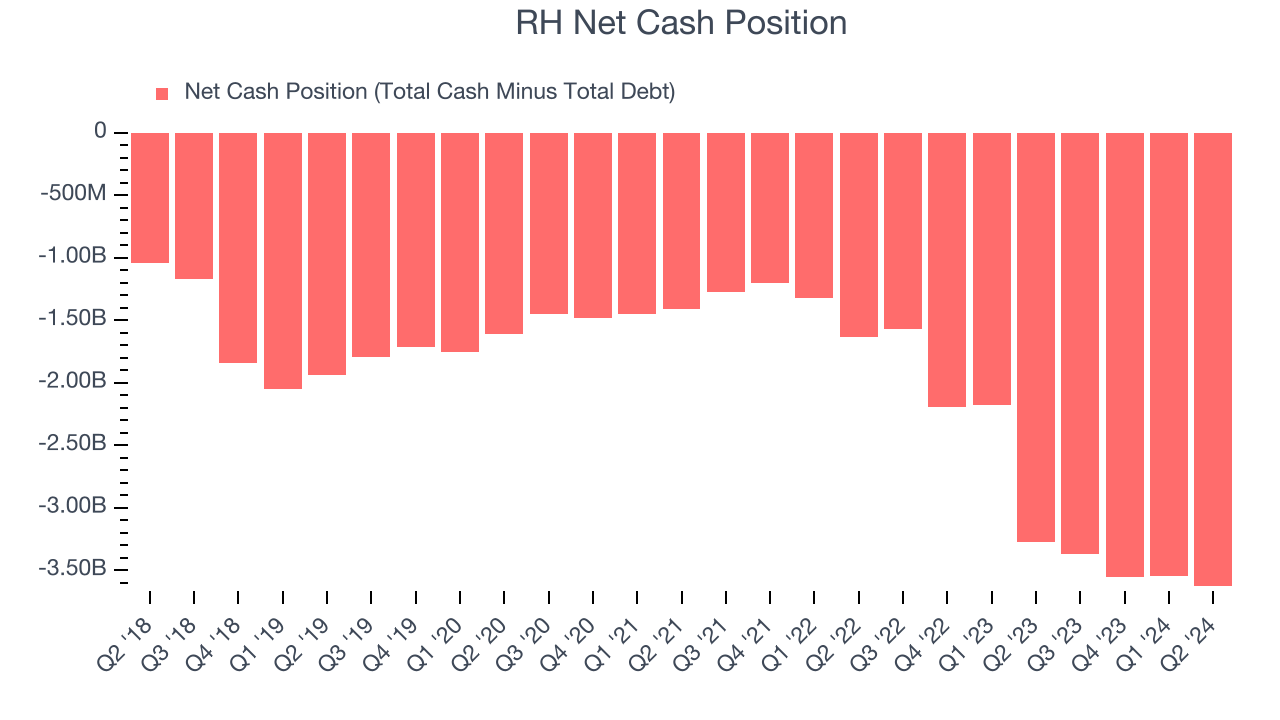
3. Short Runway Exposes Shareholders to Potential Dilution
As long-term investors, the risk we care about most is the permanent loss of capital, which can happen when a company goes bankrupt or raises money from a disadvantaged position. This is separate from short-term stock price volatility, something we are much less bothered by.
RH burned through $281.9 million of cash over the last year, and its $3.71 billion of debt exceeds the $78.33 million of cash on its balance sheet. This is a deal breaker for us because indebted loss-making companies spell trouble.
Unless the company’s fundamentals change quickly, it might find itself in a position where it must raise capital from investors to continue operating. Whether that would be favorable is unclear because dilution is a headwind for shareholder returns. We remain cautious of RH until it generates consistent free cash flow or any of its announced financing plans materialize on its balance sheet.
Final Judgment
RH isn’t a terrible business, but it isn’t one of our picks. Following the recent surge, the stock trades at 34.1x forward price-to-earnings (or $390.43 per share). At this valuation, there’s a lot of good news priced in - we think there are better investment opportunities out there. Let us point you toward Google, whose cloud computing and YouTube divisions are firing on all cylinders.
Stocks We Would Buy Instead of RH
With rates dropping, inflation stabilizing, and the elections in the rearview mirror, all signs point to the start of a new bull run - and we’re laser-focused on finding the best stocks for this upcoming cycle.
Put yourself in the driver’s seat by checking out our Top 5 Strong Momentum Stocks for this week. This is a curated list of our High Quality stocks that have generated a market-beating return of 175% over the last five years.
Stocks that made our list in 2019 include now familiar names such as Nvidia (+2,691% between September 2019 and September 2024) as well as under-the-radar businesses like United Rentals (+550% five-year return). Find your next big winner with StockStory today for free.