Real estate firm JLL (NYSE: JLL) announced better-than-expected revenue in Q3 CY2024, with sales up 14.8% year on year to $5.87 billion. Its non-GAAP profit of $3.50 per share was also 27.9% above analysts’ consensus estimates.
Is now the time to buy JLL? Find out by accessing our full research report, it’s free.
JLL (JLL) Q3 CY2024 Highlights:
- Revenue: $5.87 billion vs analyst estimates of $5.62 billion (4.4% beat)
- Adjusted EPS: $3.50 vs analyst estimates of $2.74 (27.9% beat)
- EBITDA: $298.1 million vs analyst estimates of $246.4 million (21% beat)
- Gross Margin (GAAP): 53.5%, up from 51.7% in the same quarter last year
- Operating Margin: 3.9%, up from 2.3% in the same quarter last year
- EBITDA Margin: 5.1%, in line with the same quarter last year
- Free Cash Flow Margin: 3.7%, down from 5.4% in the same quarter last year
- Market Capitalization: $13.28 billion
"JLL achieved strong third-quarter revenue and profit growth fueled by continued high demand for our outsourcing services and an acceleration in transactional activity," said Christian Ulbrich, JLL CEO.
Company Overview
Founded in 1999 through the merger of Jones Lang Wootton and LaSalle Partners, JLL (NYSE: JLL) is a company specializing in real estate advisory and investment management services.
Real Estate Services
Technology has been a double-edged sword in real estate services. On the one hand, internet listings are effective at disseminating information far and wide, casting a wide net for buyers and sellers to increase the chances of transactions. On the other hand, digitization in the real estate market could potentially disintermediate key players like agents who use information asymmetries to their advantage.
Sales Growth
A company’s long-term performance is an indicator of its overall business quality. While any business can experience short-term success, top-performing ones enjoy sustained growth for multiple years. Unfortunately, JLL’s 5.2% annualized revenue growth over the last five years was sluggish. This shows it failed to expand in any major way, a rough starting point for our analysis.
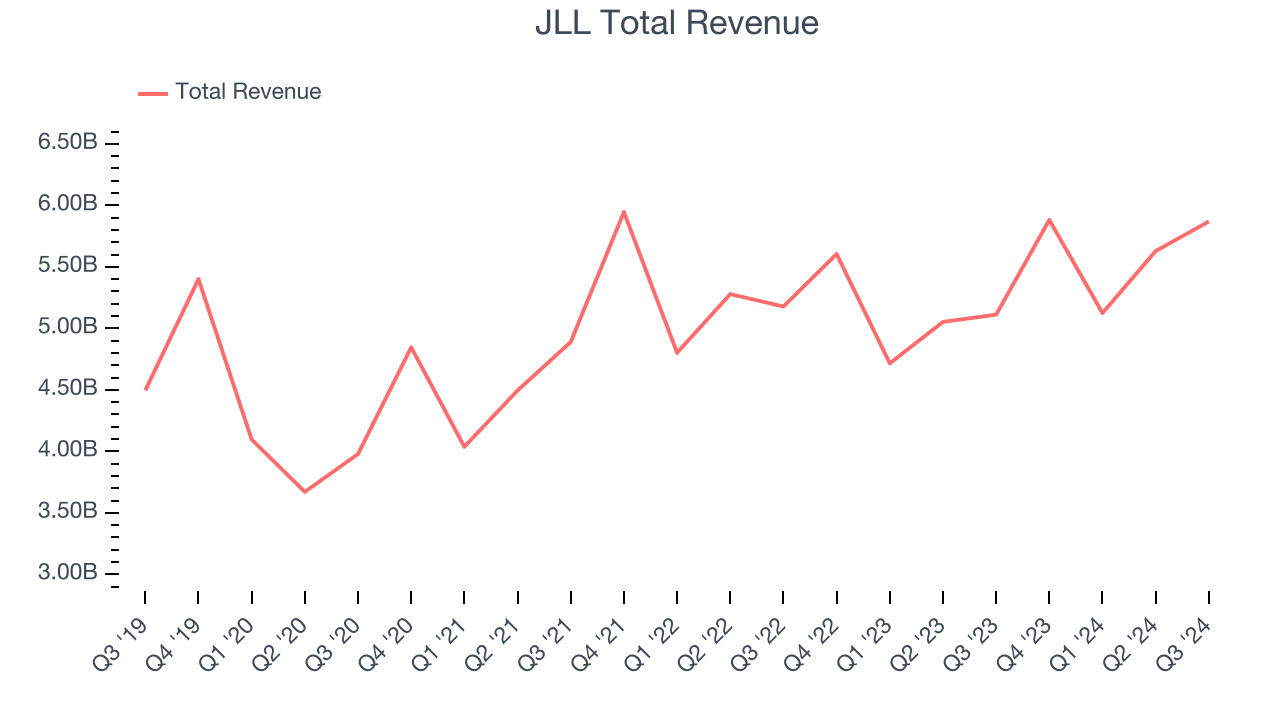
We at StockStory place the most emphasis on long-term growth, but within consumer discretionary, a stretched historical view may miss a company riding a successful new product or emerging trend. JLL’s recent history shows its demand slowed as its annualized revenue growth of 3% over the last two years is below its five-year trend. 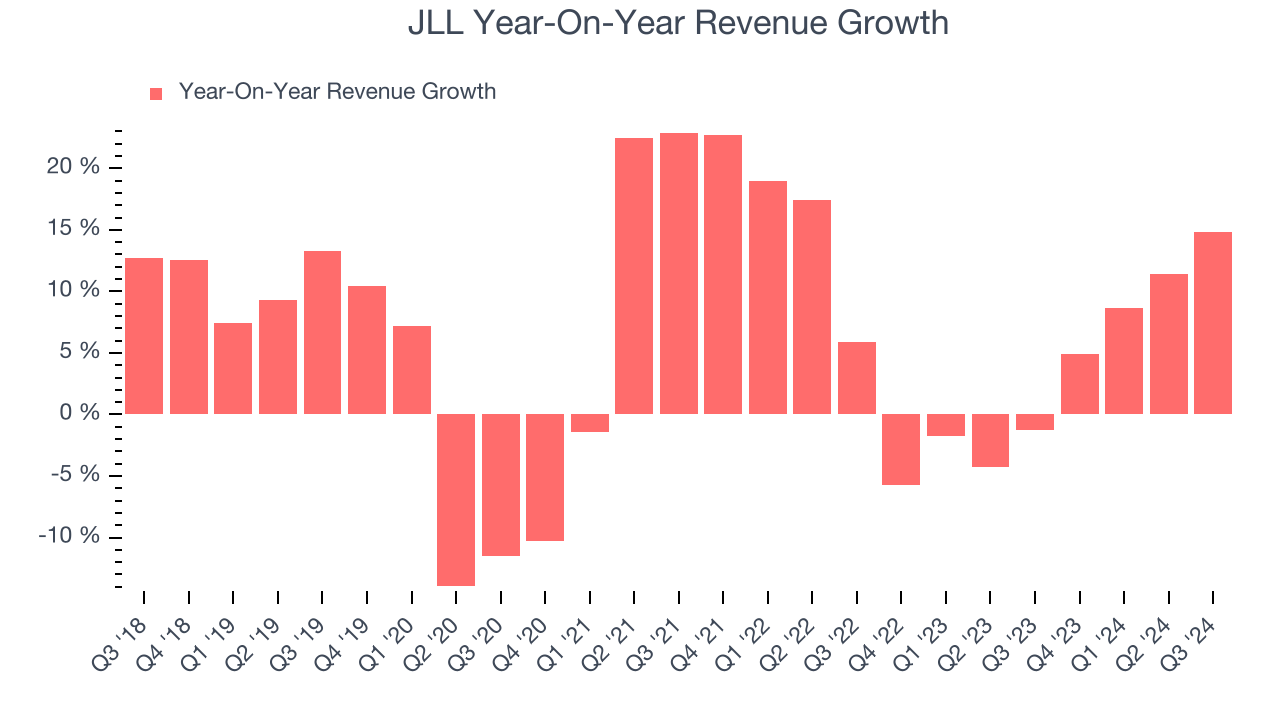
We can better understand the company’s revenue dynamics by analyzing its three most important segments: Work Dynamics, Markets Advisory, and Capital Markets, which are 69.3%, 19.5%, and 8.5% of revenue. Over the last two years, JLL’s Work Dynamics revenue (operational workflows) averaged 9.5% year-on-year growth while its Markets Advisory (real estate insights) and Capital Markets (financial transactions) revenues averaged declines of 1.9% and 16%.
This quarter, JLL reported year-on-year revenue growth of 14.8%, and its $5.87 billion of revenue exceeded Wall Street’s estimates by 4.4%.
Looking ahead, sell-side analysts expect revenue to grow 8.1% over the next 12 months, an improvement versus the last two years. Although this projection indicates the market thinks its newer products and services will spur better performance, it is still below the sector average.
Today’s young investors won’t have read the timeless lessons in Gorilla Game: Picking Winners In High Technology because it was written more than 20 years ago when Microsoft and Apple were first establishing their supremacy. But if we apply the same principles, then enterprise software stocks leveraging their own generative AI capabilities may well be the Gorillas of the future. So, in that spirit, we are excited to present our Special Free Report on a profitable, fast-growing enterprise software stock that is already riding the automation wave and looking to catch the generative AI next.
Cash Is King
Free cash flow isn't a prominently featured metric in company financials and earnings releases, but we think it's telling because it accounts for all operating and capital expenses, making it tough to manipulate. Cash is king.
JLL has shown poor cash profitability over the last two years, giving the company limited opportunities to return capital to shareholders. Its free cash flow margin averaged 1.5%, lousy for a consumer discretionary business.
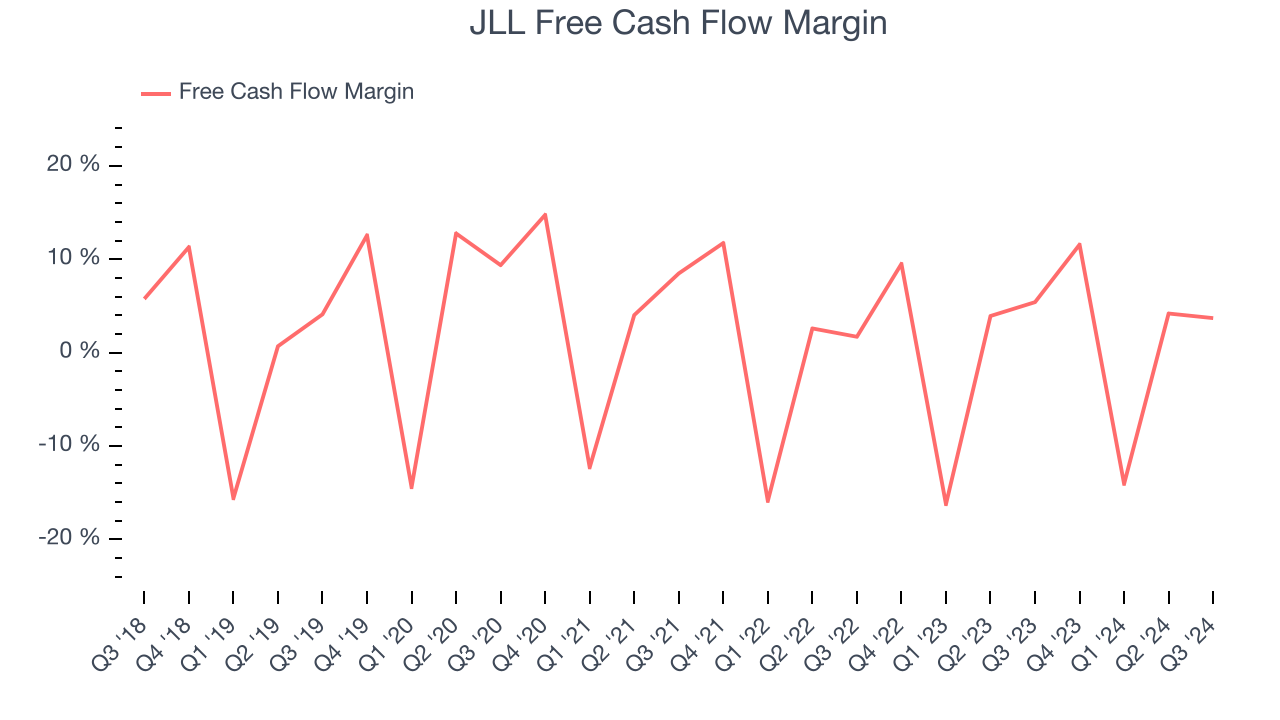
JLL’s free cash flow clocked in at $216.7 million in Q3, equivalent to a 3.7% margin. The company’s cash profitability regressed as it was 1.7 percentage points lower than in the same quarter last year, but it’s still above its two-year average. We wouldn’t put too much weight on this quarter’s decline because investment needs can be seasonal, causing short-term swings. Long-term trends are more important.
Key Takeaways from JLL’s Q3 Results
We were impressed by how significantly JLL blew past analysts’ EPS expectations this quarter. We were also excited its EBITDA outperformed Wall Street’s estimates. Zooming out, we think this was a solid quarter. The stock traded up 3.2% to $288.79 immediately following the results.
JLL put up rock-solid earnings, but one quarter doesn’t necessarily make the stock a buy. Let’s see if this is a good investment. What happened in the latest quarter matters, but not as much as longer-term business quality and valuation, when deciding whether to invest in this stock. We cover that in our actionable full research report which you can read here, it’s free.