
Dating app company Match (NASDAQ: MTCH) met Wall Street’s revenue expectations in Q3 CY2024, with sales up 1.6% year on year to $895.5 million. Next quarter’s revenue guidance of $867.5 million underwhelmed, coming in 4.1% below analysts’ estimates. Its GAAP profit of $0.51 per share was 6.4% above analysts’ consensus estimates.
Is now the time to buy Match Group? Find out by accessing our full research report, it’s free.
Match Group (MTCH) Q3 CY2024 Highlights:
- Revenue: $895.5 million vs analyst estimates of $900.9 million (in line)
- EPS: $0.51 vs analyst estimates of $0.48 (6.4% beat)
- EBITDA: $342.5 million vs analyst estimates of $338.3 million (1.3% beat)
- Revenue Guidance for Q4 CY2024 is $867.5 million at the midpoint, below analyst estimates of $904.6 million
- Gross Margin (GAAP): 71.7%, in line with the same quarter last year
- Operating Margin: 23.5%, down from 27.6% in the same quarter last year
- EBITDA Margin: 38.3%, in line with the same quarter last year
- Free Cash Flow Margin: 28.1%, up from 13.5% in the previous quarter
- Payers: 15.2 million, down 512,000 year on year
- Market Capitalization: $9.53 billion
Company Overview
Originally started as a dial-up service before widespread internet adoption, Match (NASDAQ: MTCH) was an early innovator in online dating and today has a portfolio of apps including Tinder, Hinge, Archer, and OkCupid.
Consumer Subscription
Consumers today expect goods and services to be hyper-personalized and on demand. Whether it be what music they listen to, what movie they watch, or even finding a date, online consumer businesses are expected to delight their customers with simple user interfaces that magically fulfill demand. Subscription models have further increased usage and stickiness of many online consumer services.
Sales Growth
A company’s long-term performance can give signals about its business quality. Even a bad business can shine for one or two quarters, but a top-tier one grows for years. Unfortunately, Match Group’s 7.2% annualized revenue growth over the last three years was tepid. This shows it failed to expand in any major way, a rough starting point for our analysis.
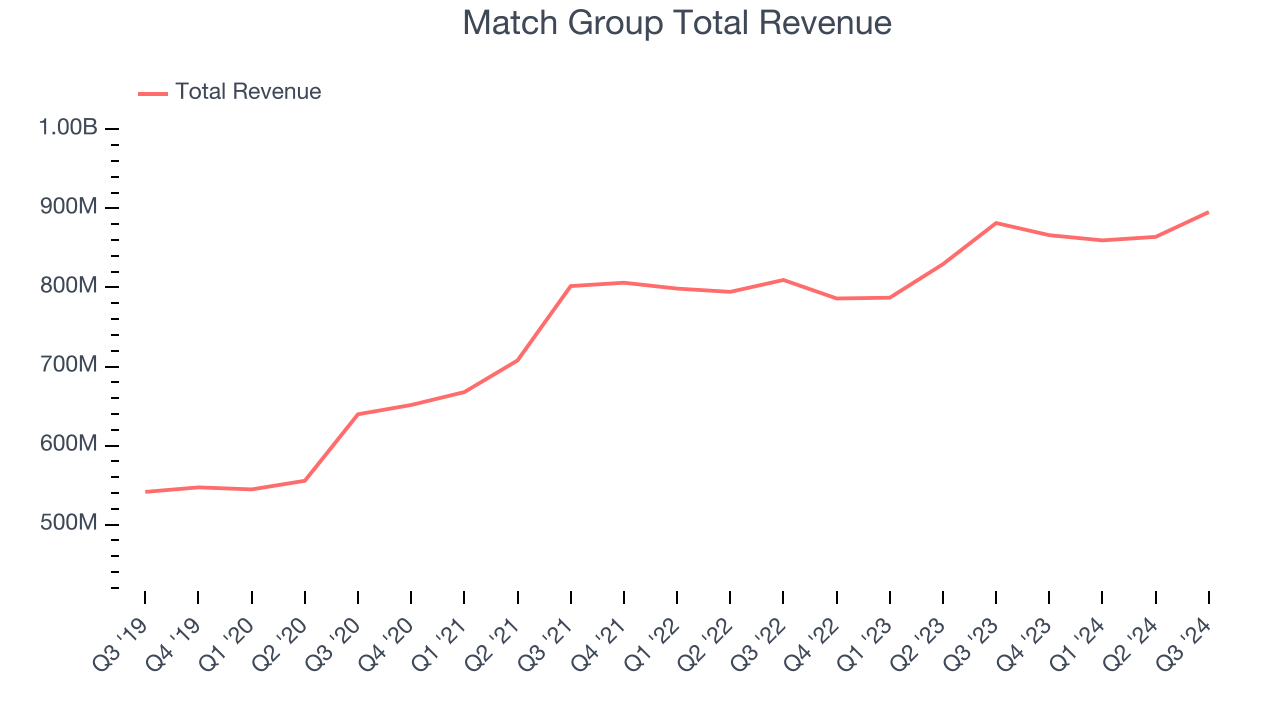
This quarter, Match Group grew its revenue by 1.6% year on year, and its $895.5 million of revenue was in line with Wall Street’s estimates. Management is currently guiding for flat sales next quarter.
Looking further ahead, sell-side analysts expect revenue to grow 6.2% over the next 12 months, similar to its three-year rate. This projection is underwhelming and indicates the market thinks its newer products and services will not lead to better top-line performance yet. At least the company is tracking well in other measures of financial health.
Here at StockStory, we certainly understand the potential of thematic investing. Diverse winners from Microsoft (MSFT) to Alphabet (GOOG), Coca-Cola (KO) to Monster Beverage (MNST) could all have been identified as promising growth stories with a megatrend driving the growth. So, in that spirit, we’ve identified a relatively under-the-radar profitable growth stock benefitting from the rise of AI, available to you FREE via this link.
Payers
User Growth
As a subscription-based app, Match Group generates revenue growth by expanding both its subscriber base and the amount each subscriber spends over time.
Match Group struggled to engage its payers over the last two years as they have declined by 4.2% annually to 15.2 million in the latest quarter. This performance isn't ideal because internet usage is secular. If Match Group wants to accelerate growth, it must enhance the appeal of its current offerings or innovate with new products. 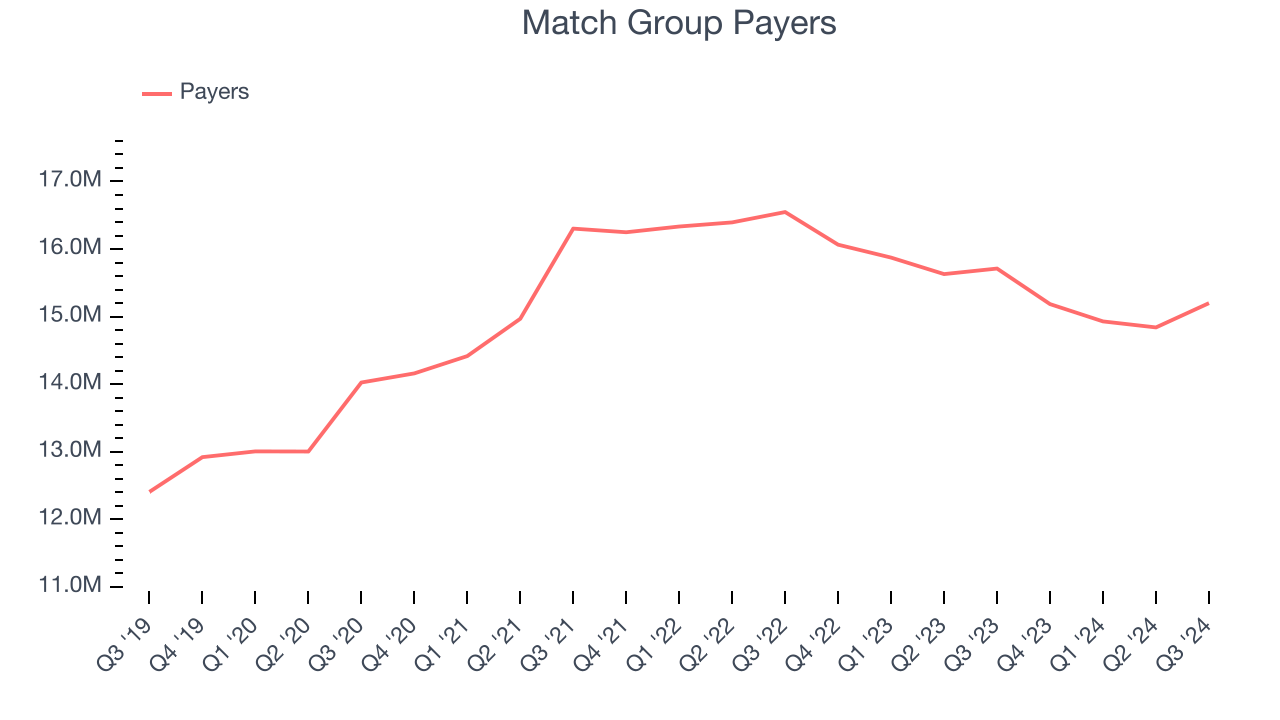
In Q3, Match Group’s payers once again decreased by 512,000, a 3.3% drop since last year. The quarterly print isn’t too different from its two-year result, suggesting its new initiatives aren’t accelerating user growth just yet.
Revenue Per User
Average revenue per user (ARPU) is a critical metric to track for consumer internet businesses like Match Group because it measures how much the average user spends. ARPU is also a key indicator of how valuable its users are (and can be over time).
Match Group’s ARPU growth has been excellent over the last two years, averaging 9%. Although its payers shrank during this time, the company’s ability to successfully increase monetization demonstrates its platform’s value for existing users. 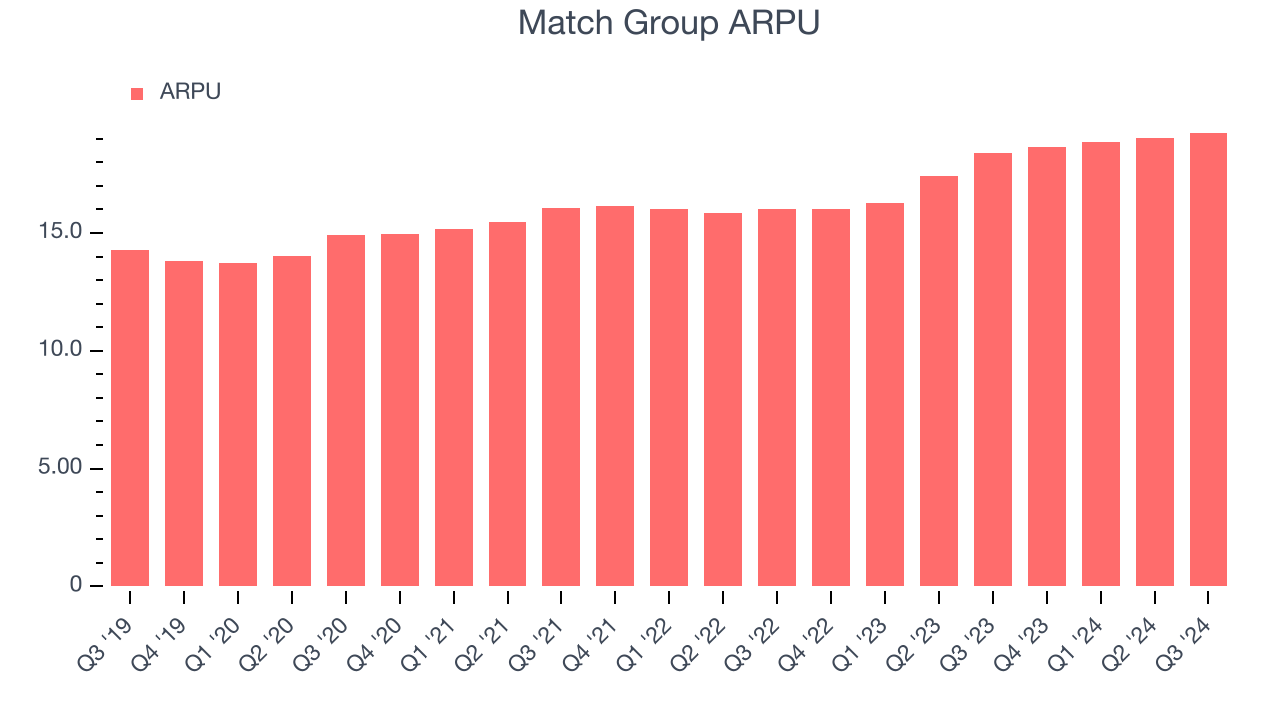
This quarter, Match Group’s ARPU clocked in at $19.26. It grew 4.7% year on year, faster than its payers.
Key Takeaways from Match Group’s Q3 Results
It was good to see Match Group beat analysts’ EBITDA expectations this quarter. On the other hand, its revenue guidance for next quarter missed analysts’ expectations and its revenue growth was quite weak. The company stated that "Tinder MAU was down 9% Y/Y in Q3, which was the same rate of decline as in Q2, falling short of our expectations for continued improvement in Y/Y trends. From mid-September through October, we saw more pressure on new users (registrations and reactivations) than we expected, which has led to pressure on MAU." Overall, this was a weaker quarter. The stock traded down 12.5% to $33.10 immediately following the results.
The latest quarter from Match Group’s wasn’t that good. One earnings report doesn’t define a company’s quality, though, so let’s explore whether the stock is a buy at the current price. When making that decision, it’s important to consider its valuation, business qualities, as well as what has happened in the latest quarter. We cover that in our actionable full research report which you can read here, it’s free.