
Television broadcasting and media company Sinclair (NASDAQ: SBGI) met Wall Street’s revenue expectations in Q3 CY2024, with sales up 19.6% year on year to $917 million. Next quarter’s revenue guidance of $1.01 billion underwhelmed, coming in 2.4% below analysts’ estimates. Its GAAP profit of $1.43 per share was 41.4% above analysts’ consensus estimates.
Is now the time to buy Sinclair? Find out by accessing our full research report, it’s free.
Sinclair (SBGI) Q3 CY2024 Highlights:
- Revenue: $917 million vs analyst estimates of $924.6 million (in line)
- EPS: $1.43 vs analyst estimates of $1.01 (41.4% beat)
- EBITDA: $249 million vs analyst estimates of $253.3 million (1.7% miss)
- Revenue Guidance for Q4 CY2024 is $1.01 billion at the midpoint, below analyst estimates of $1.03 billion
- Operating Margin: 19.5%, up from 4.8% in the same quarter last year
- EBITDA Margin: 27.2%, up from 18.9% in the same quarter last year
- Market Capitalization: $1.11 billion
Company Overview
Founded in 1971, Sinclair (NASDAQ: SBGI) is an American media company operating numerous television stations and providing multi-platform broadcasting services.
Broadcasting
Broadcasting companies have been facing secular headwinds in the form of consumers abandoning traditional television and radio in favor of streaming services. As a result, many broadcasting companies have evolved by forming distribution agreements with major streaming platforms so they can get in on part of the action, but will these subscription revenues be as high quality and high margin as their legacy revenues? Only time will tell which of these broadcasters will survive the sea changes of technological advancement and fragmenting consumer attention.
Sales Growth
A company’s long-term performance can give signals about its business quality. Even a bad business can shine for one or two quarters, but a top-tier one grows for years. Sinclair’s demand was weak over the last five years as its sales were flat, a poor baseline for our analysis.
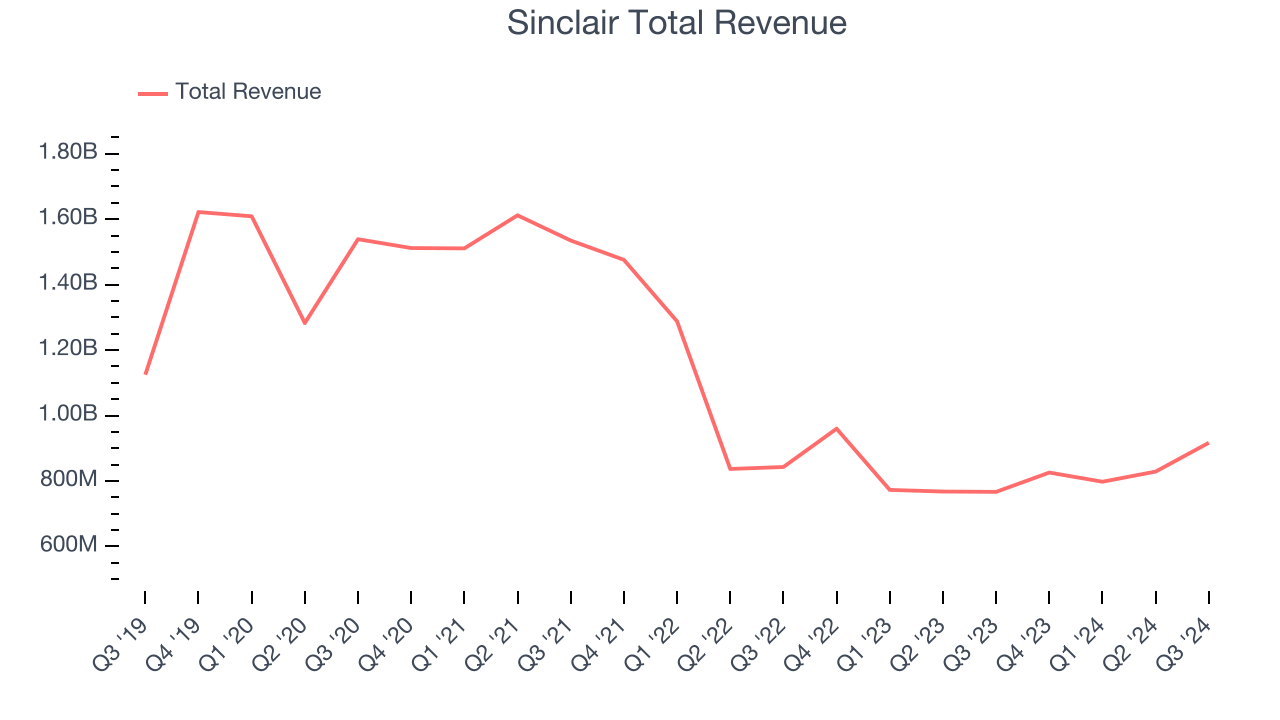
Long-term growth is the most important, but within consumer discretionary, product cycles are short and revenue can be hit-driven due to rapidly changing trends and consumer preferences. Sinclair’s recent history shows its demand has stayed suppressed as its revenue has declined by 12.9% annually over the last two years. 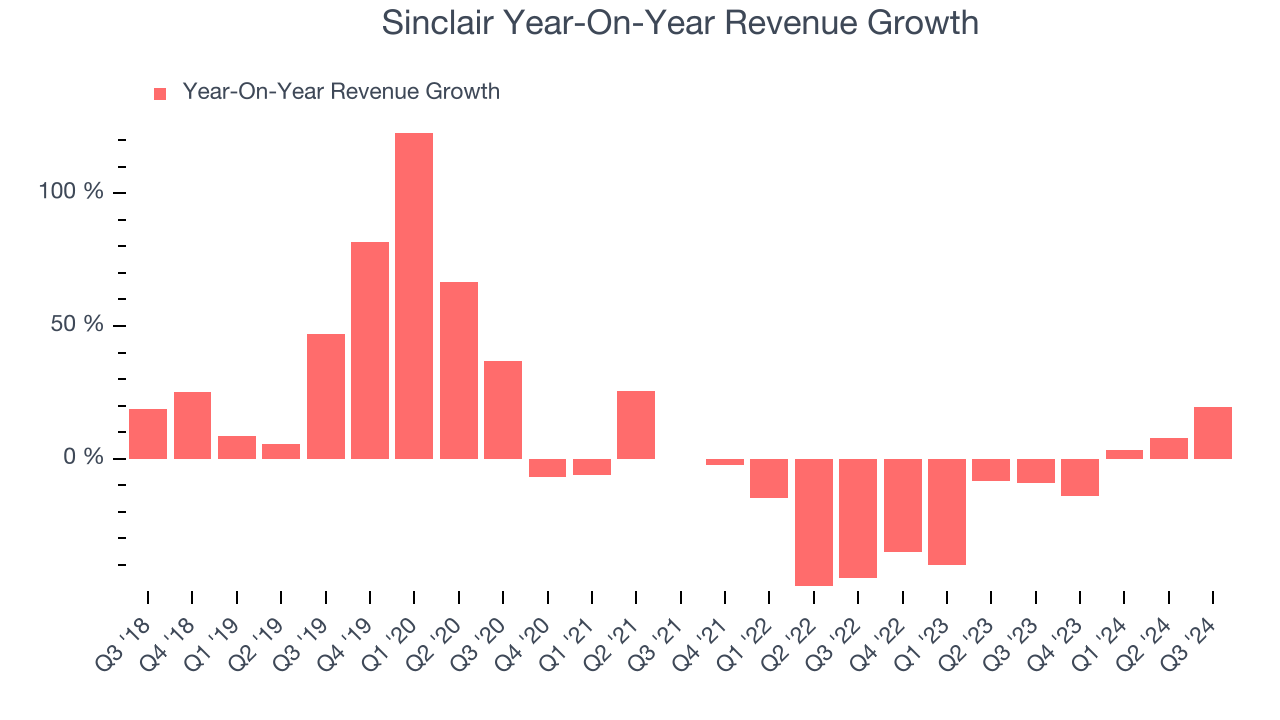
We can dig further into the company’s revenue dynamics by analyzing its most important segments, Distribution and Advertising, which are 47.3% and 32.2% of revenue. Over the last two years, Sinclair’s Distribution revenue (content distribution) averaged 13% year-on-year declines while its Advertising revenue (advertising sales) averaged 4.4% declines.
This quarter, Sinclair’s year-on-year revenue growth was 19.6%, and its $917 million of revenue was in line with Wall Street’s estimates. Management is currently guiding for a 22.2% year-on-year increase next quarter.
Looking further ahead, sell-side analysts expect revenue to grow 3.6% over the next 12 months, an improvement versus the last two years. While this projection indicates the market believes its newer products and services will spur better performance, it is still below average for the sector.
Unless you’ve been living under a rock, it should be obvious by now that generative AI is going to have a huge impact on how large corporations do business. While Nvidia and AMD are trading close to all-time highs, we prefer a lesser-known (but still profitable) semiconductor stock benefitting from the rise of AI. Click here to access our free report on our favorite semiconductor growth story.
Cash Is King
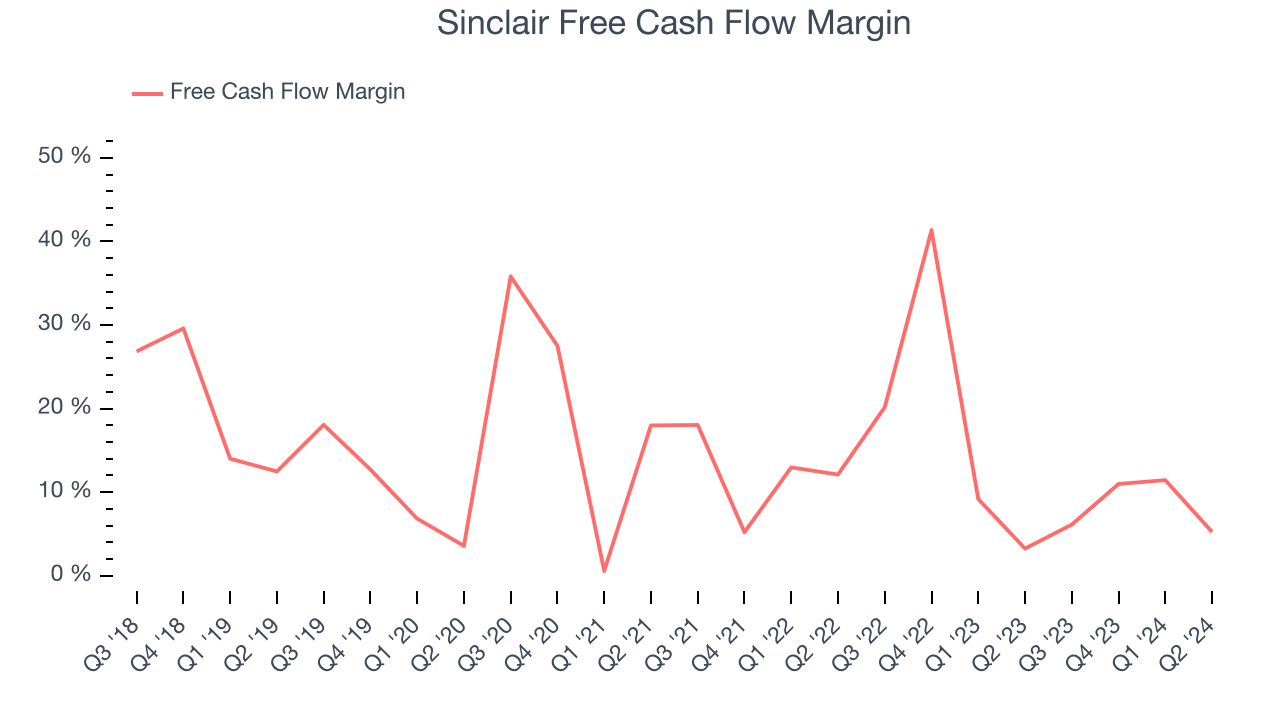
Although earnings are undoubtedly valuable for assessing company performance, we believe cash is king because you can’t use accounting profits to pay the bills.
Sinclair has shown impressive cash profitability, giving it the option to reinvest or return capital to investors. The company’s free cash flow margin averaged 13.4% over the last two years, better than the broader consumer discretionary sector. The divergence from its underwhelming operating margin stems from the add-back of non-cash charges like depreciation and stock-based compensation. GAAP operating profit expenses these line items, but free cash flow does not.
Key Takeaways from Sinclair’s Q3 Results
We were impressed by how significantly Sinclair blew past analysts’ EPS expectations this quarter. On the other hand, its Distribution revenue missed and its revenue guidance for next quarter came in slightly below Wall Street’s estimates. Zooming out, we think this was a mixed quarter. The stock remained flat at $17.41 immediately following the results.
Should you buy the stock or not? If you’re making that decision, you should consider the bigger picture of valuation, business qualities, as well as the latest earnings. We cover that in our actionable full research report which you can read here, it’s free.


