
E-commerce software platform provider BigCommerce (NASDAQ: BIGC) met Wall Street’s revenue expectations in Q3 CY2024, with sales up 7.3% year on year to $83.71 million. On the other hand, next quarter’s revenue guidance of $86.8 million was less impressive, coming in 1.2% below analysts’ estimates. Its non-GAAP profit of $0.06 per share was 98.2% above analysts’ consensus estimates.
Is now the time to buy BigCommerce? Find out by accessing our full research report, it’s free.
BigCommerce (BIGC) Q3 CY2024 Highlights:
- Revenue: $83.71 million vs analyst estimates of $83.09 million (in line)
- Adjusted EPS: $0.06 vs analyst estimates of $0.03 ($0.03 beat)
- EBITDA: $5.37 million vs analyst estimates of $2.85 million (88.3% beat)
- Revenue Guidance for Q4 CY2024 is $86.8 million at the midpoint, below analyst estimates of $87.82 million
- Gross Margin (GAAP): 76.3%, in line with the same quarter last year
- Operating Margin: -23%, up from -28.4% in the same quarter last year
- EBITDA Margin: 6.4%, up from -0.1% in the same quarter last year
- Free Cash Flow Margin: 5.4%, down from 13% in the previous quarter
- Annual Recurring Revenue: $347.8 million at quarter end, up 4.7% year on year
- Market Capitalization: $442.4 million
“BigCommerce has been significantly underrepresented in the marketplace relative to the strength of our products,” said Travis Hess, CEO of BigCommerce.
Company Overview
Founded in Sydney, Australia in 2009 by Mitchell Harper and Eddie Machaalani, BigCommerce (NASDAQ: BIGC) provides software for businesses to easily create online stores.
E-commerce Software
While e-commerce has been around for over two decades and enjoyed meaningful growth, its overall penetration of retail still remains low. Only around $1 in every $5 spent on retail purchases comes from digital orders, leaving over 80% of the retail market still ripe for online disruption. It is these large swathes of the retail where e-commerce has not yet taken hold that drives the demand for various e-commerce software solutions.
Sales Growth
Examining a company’s long-term performance can provide clues about its business quality. Any business can put up a good quarter or two, but the best consistently grow over the long haul. Unfortunately, BigCommerce’s 18.5% annualized revenue growth over the last three years was mediocre. This shows it couldn’t expand in any major way, a tough starting point for our analysis.
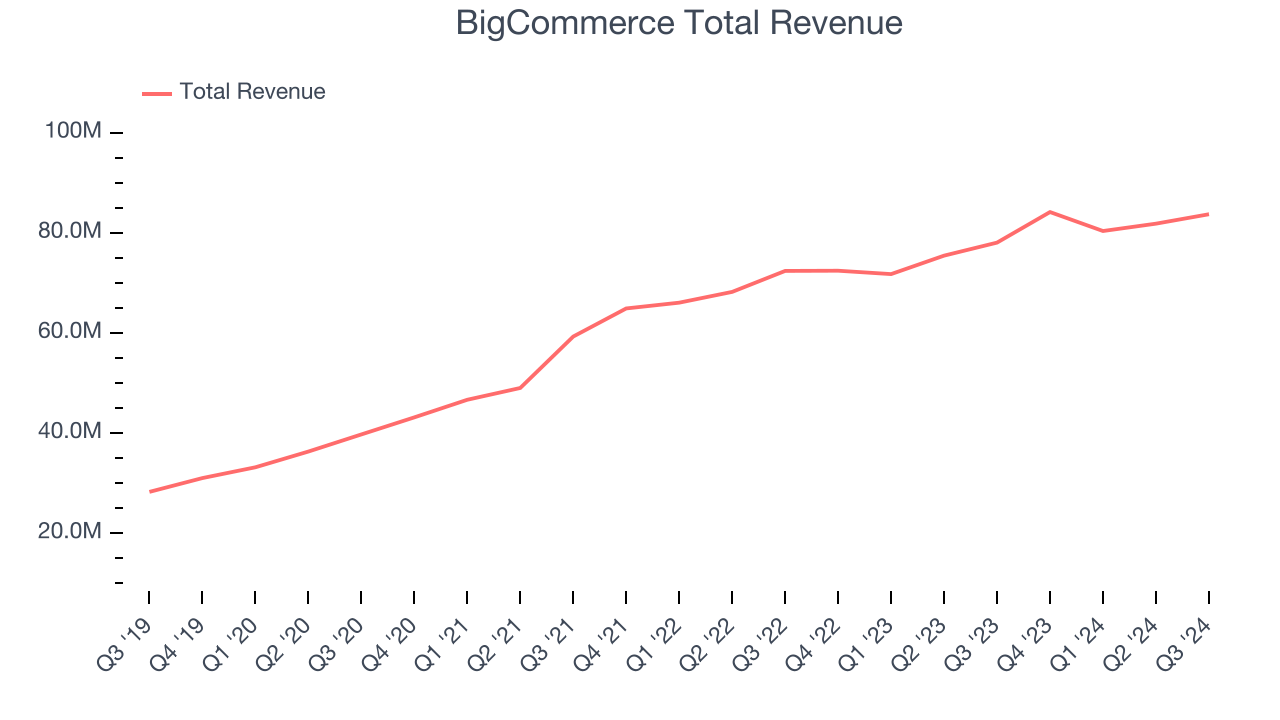
This quarter, BigCommerce grew its revenue by 7.3% year on year, and its $83.71 million of revenue was in line with Wall Street’s estimates. Management is currently guiding for a 3.2% year-on-year increase next quarter.
Looking further ahead, sell-side analysts expect revenue to grow 6.3% over the next 12 months, a deceleration versus the last three years. This projection is underwhelming and shows the market thinks its products and services will face some demand challenges.
When a company has more cash than it knows what to do with, buying back its own shares can make a lot of sense–as long as the price is right. Luckily, we’ve found one, a low-priced stock that is gushing free cash flow AND buying back shares. Click here to claim your Special Free Report on a fallen angel growth story that is already recovering from a setback.
Annual Recurring Revenue
Investors interested in BigCommerce should track its annual recurring revenue (ARR) in addition to reported revenue. While reported revenue for a SaaS company can include low-margin items like implementation fees, ARR is a sum of the next 12 months of contracted revenue purely from software subscriptions, or the high-margin, predictable revenue streams that make SaaS businesses so valuable.
Over the last year, BigCommerce’s ARR growth has flat-out bad, averaging 6.1% year-on-year increases and coming in at $347.8 million in the latest quarter. This alternate topline metric has been growing slower than revenue, which likely means that the recurring portions of the business are growing slower than less predictable, choppier ones such as implementation fees. If this continues, the quality of its revenue base could decline. 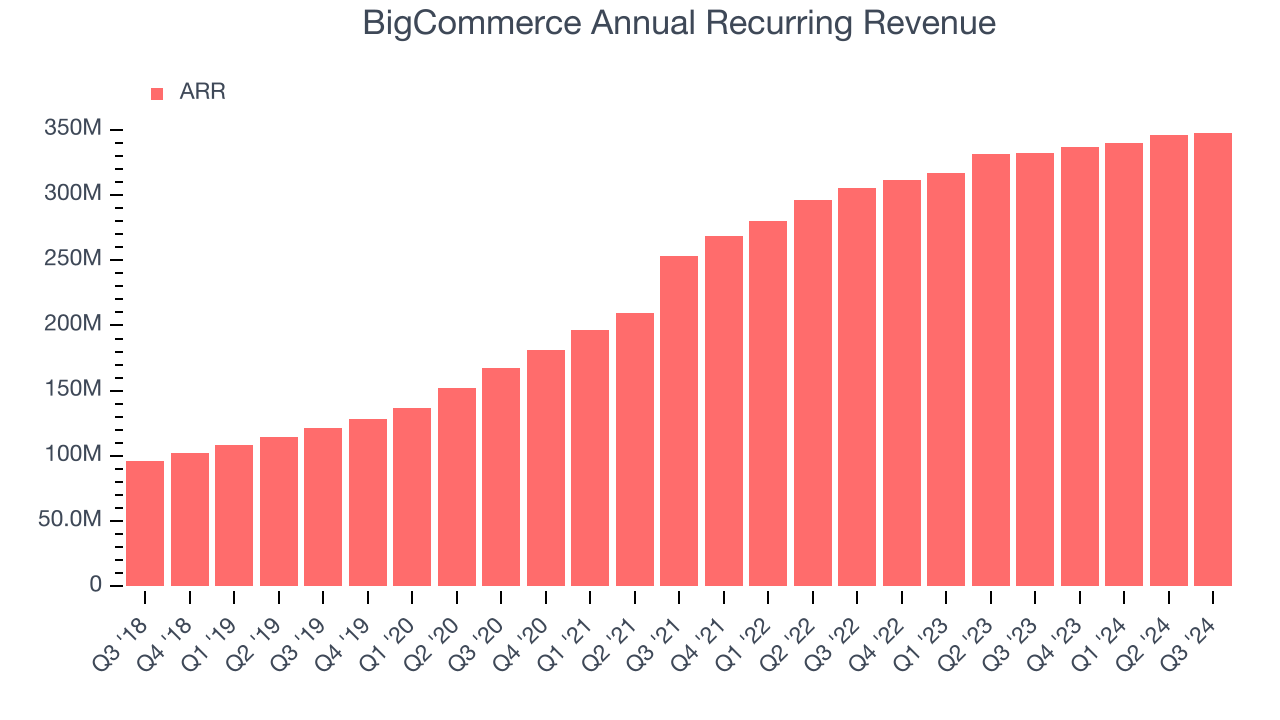
Customer Acquisition Efficiency
The customer acquisition cost (CAC) payback period measures the months a company needs to recoup the money spent on acquiring a new customer. This metric helps assess how quickly a business can break even on its sales and marketing investments.
BigCommerce is efficient at acquiring new customers, and its CAC payback period checked in at 36.8 months this quarter. The company’s performance indicates relatively solid competitive positioning, giving it the freedom to invest its resources into new growth initiatives.
Key Takeaways from BigCommerce’s Q3 Results
We were impressed by how significantly BigCommerce blew past analysts’ EPS and EBITDA expectations this quarter. On the other hand, its revenue guidance for next quarter and its ARR missed Wall Street’s estimates. Overall, this was a mixed quarter. The stock traded up 5.1% to $5.98 immediately following the results due to the profit beats.
Should you buy the stock or not? When making that decision, it’s important to consider its valuation, business qualities, as well as what has happened in the latest quarter. We cover that in our actionable full research report which you can read here, it’s free.


