
Nuclear power company NuScale (NYSE: SMR) fell short of the market’s revenue expectations in Q3 CY2024, with sales falling 93.2% year on year to $475,000. Its GAAP loss of $0.18 per share was also 20% below analysts’ consensus estimates.
Is now the time to buy NuScale? Find out by accessing our full research report, it’s free.
NuScale (SMR) Q3 CY2024 Highlights:
- Revenue: $0.5 million vs analyst estimates of $10.71 million (large miss)
- EPS: -$0.18 vs analyst expectations of -$0.15 (20% miss)
- Gross Margin (GAAP): 37.9%, up from 14.5% in the same quarter last year
- Operating Margin: -8,636%, down from -1,337% in the same quarter last year
- Market Capitalization: $2.03 billion
“As energy demand grows, the world’s largest technology companies are urgently seeking sources of secure, clean, reliable nuclear power, and NuScale is uniquely positioned to serve their needs for uninterrupted energy,” said John Hopkins, President and Chief Executive Officer of NuScale Power.
Company Overview
Founded by a team of nuclear scientists, NuScale (NYSE: SMR) specializes in small modular reactor technology, providing scalable nuclear power solutions.
Renewable Energy
Renewable energy companies are buoyed by the secular trend of green energy that is upending traditional power generation. Those who innovate and evolve with this dynamic market can win share while those who continue to rely on legacy technologies can see diminishing demand, which includes headwinds from increasing regulation against “dirty” energy. Additionally, these companies are at the whim of economic cycles, as interest rates can impact the willingness to invest in renewable energy projects.
Sales Growth
A company’s long-term performance can give signals about its business quality. Even a bad business can shine for one or two quarters, but a top-tier one grows for years. Thankfully, NuScale’s 66.1% annualized revenue growth over the last three years was incredible. This is a useful starting point for our analysis.
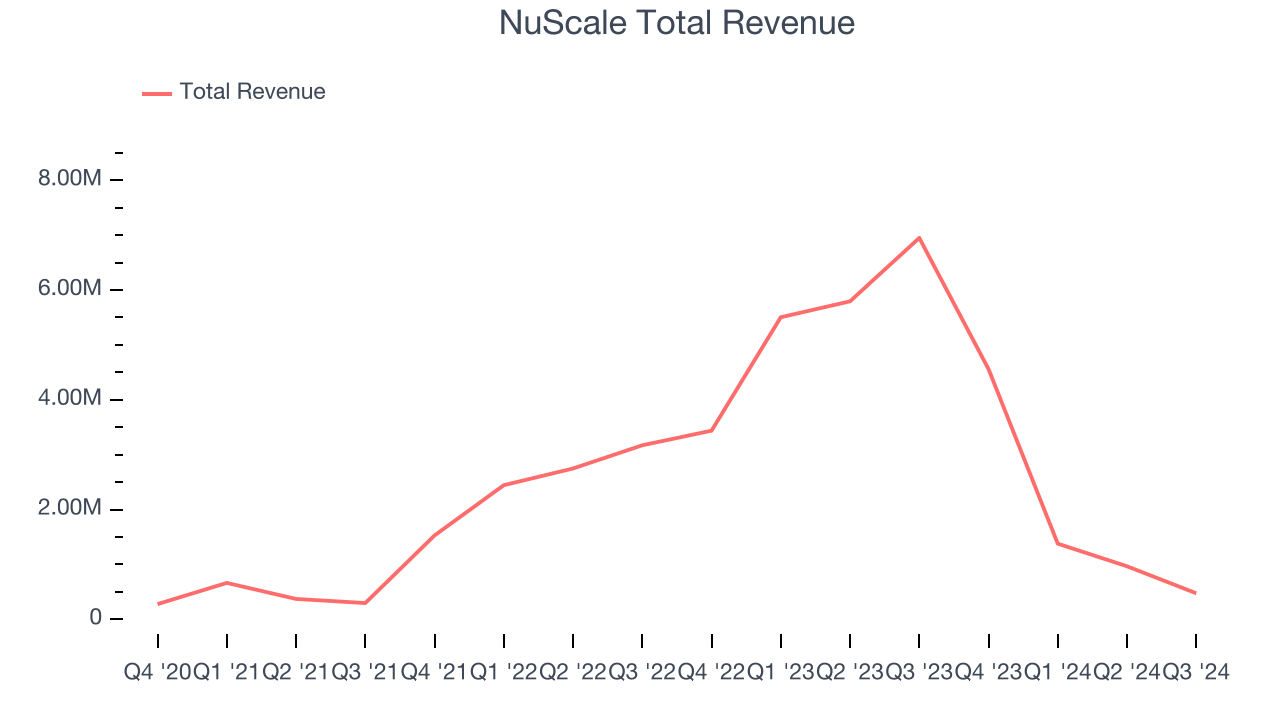
Long-term growth is the most important, but within industrials, a stretched historical view may miss new industry trends or demand cycles. NuScale’s recent history marks a sharp pivot from its three-year trend as its revenue has shown annualized declines of 13.6% over the last two years. 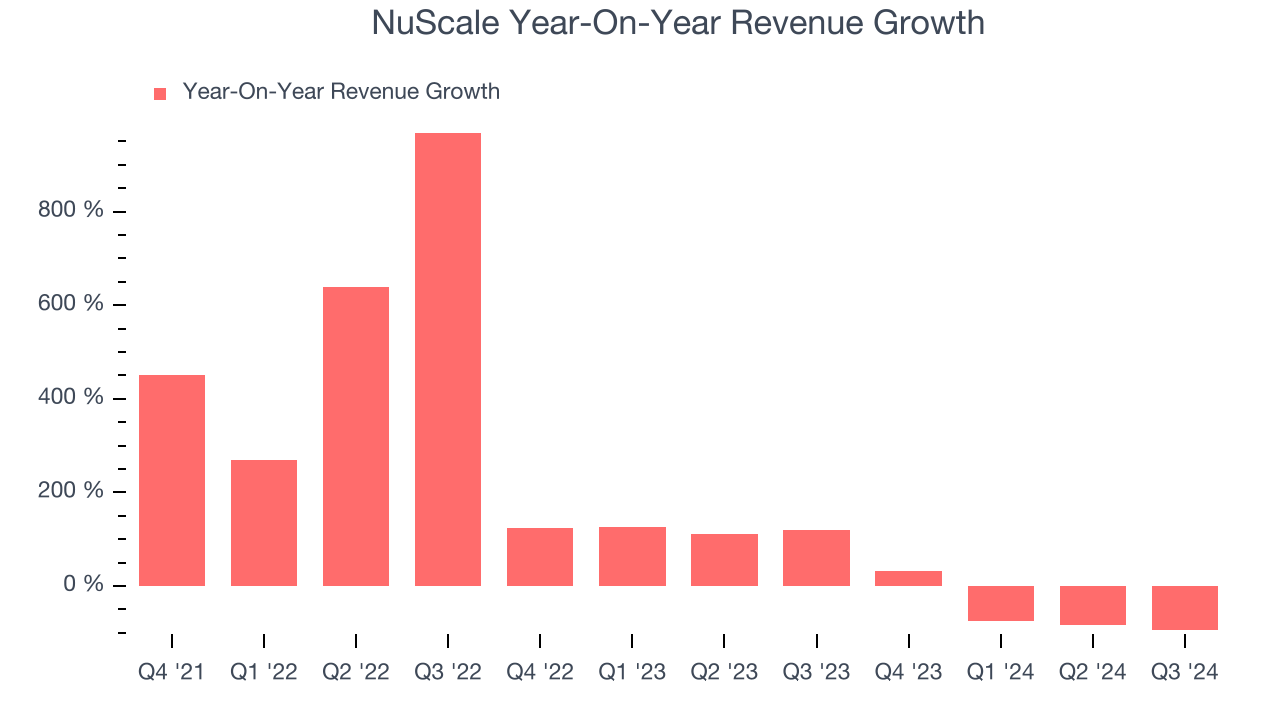
This quarter, NuScale missed Wall Street’s estimates and reported a rather uninspiring 93.2% year-on-year revenue decline, generating $475,000 of revenue.
Looking ahead, sell-side analysts expect revenue to grow 189% over the next 12 months, an improvement versus the last two years. This projection is commendable and shows the market thinks its newer products and services will fuel higher growth rates.
When a company has more cash than it knows what to do with, buying back its own shares can make a lot of sense–as long as the price is right. Luckily, we’ve found one, a low-priced stock that is gushing free cash flow AND buying back shares. Click here to claim your Special Free Report on a fallen angel growth story that is already recovering from a setback.
Operating Margin
Operating margin is a key measure of profitability. Think of it as net income–the bottom line–excluding the impact of taxes and interest on debt, which are less connected to business fundamentals.
NuScale’s high expenses have contributed to an average operating margin of negative 2,086% over the last four years. Unprofitable industrials companies require extra attention because they could get caught swimming naked when the tide goes out. It’s hard to trust that the business can endure a full cycle.
On the plus side, NuScale’s annual operating margin rose over the last four years, as its sales growth gave it operating leverage. Still, it will take much more for the company to reach long-term profitability.
NuScale’s operating margin was negative 8,636% this quarter. The company's lacking profits are certainly concerning.
Earnings Per Share
We track the change in earnings per share (EPS) for the same reason as long-term revenue growth. Compared to revenue, however, EPS highlights whether a company’s growth was profitable.
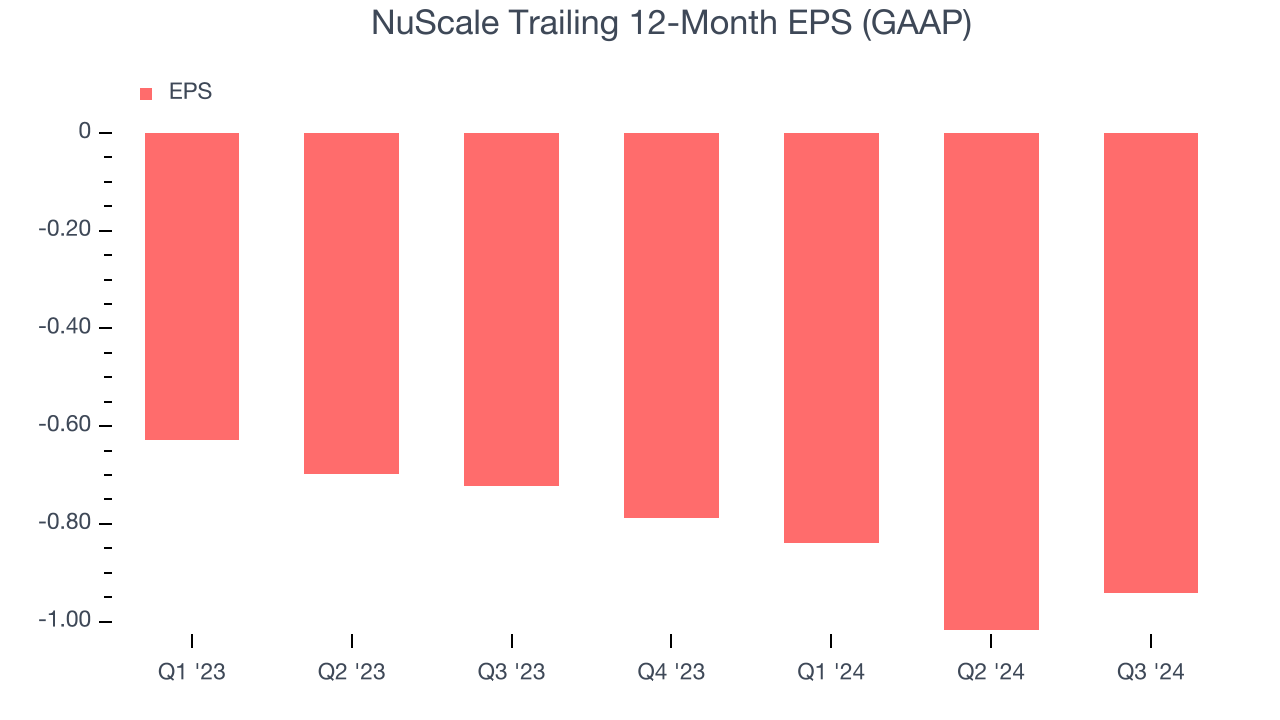
NuScale’s earnings losses deepened over the last two years as its EPS dropped 29.2% annually. We tend to steer our readers away from companies with falling revenue and EPS, where diminishing earnings could imply changing secular trends and preferences. If the tide turns unexpectedly, NuScale’s low margin of safety could leave its stock price susceptible to large downswings.
In Q3, NuScale reported EPS at negative $0.18, up from negative $0.26 in the same quarter last year. Despite growing year on year, this print missed analysts’ estimates. Over the next 12 months, Wall Street expects NuScale to improve its earnings losses. Analysts forecast its full-year EPS of negative $0.94 will advance to negative $0.62.
Key Takeaways from NuScale’s Q3 Results
We struggled to find many strong positives in these results. Its revenue missed and its EPS fell short of Wall Street’s estimates. Overall, this was a weaker quarter. The stock traded down 4.8% to $20.60 immediately after reporting.
NuScale’s earnings report left more to be desired. Let’s look forward to see if this quarter has created an opportunity to buy the stock. If you’re making that decision, you should consider the bigger picture of valuation, business qualities, as well as the latest earnings. We cover that in our actionable full research report which you can read here, it’s free.


