
Real estate technology company The Real Brokerage (NASDAQ: REAX) announced better-than-expected revenue in Q3 CY2024, with sales up 73.5% year on year to $372.5 million. Its GAAP loss of $0.01 per share was also 66.7% above analysts’ consensus estimates.
Is now the time to buy The Real Brokerage? Find out by accessing our full research report, it’s free.
The Real Brokerage (REAX) Q3 CY2024 Highlights:
- Revenue: $372.5 million vs analyst estimates of $346.8 million (7.4% beat)
- EPS: -$0.01 vs analyst estimates of -$0.03 ($0.02 beat)
- EBITDA: $13.25 million vs analyst estimates of $7.16 million (85% beat)
- Gross Margin (GAAP): 8.6%, in line with the same quarter last year
- Operating Margin: -0.7%, up from -1.8% in the same quarter last year
- EBITDA Margin: 3.6%, up from 1.6% in the same quarter last year
- Free Cash Flow was $6.83 million, up from -$8.13 million in the same quarter last year
- Market Capitalization: $1.10 billion
“Real delivered another exceptional quarter underpinned by industry-leading growth and innovation,” said Tamir Poleg, Real’s Chairman and Chief Executive Officer.
Company Overview
Founded in Toronto, Canada in 2014, The Real Brokerage (NASDAQ: REAX) is a technology-driven real estate brokerage firm combining a tech-centric model with an agent-centric philosophy.
Real Estate Services
Technology has been a double-edged sword in real estate services. On the one hand, internet listings are effective at disseminating information far and wide, casting a wide net for buyers and sellers to increase the chances of transactions. On the other hand, digitization in the real estate market could potentially disintermediate key players like agents who use information asymmetries to their advantage.
Sales Growth
A company’s long-term performance can give signals about its business quality. Even a bad business can shine for one or two quarters, but a top-tier one grows for years. Luckily, The Real Brokerage’s sales grew at an incredible 139% compounded annual growth rate over the last five years. This is a useful starting point for our analysis.
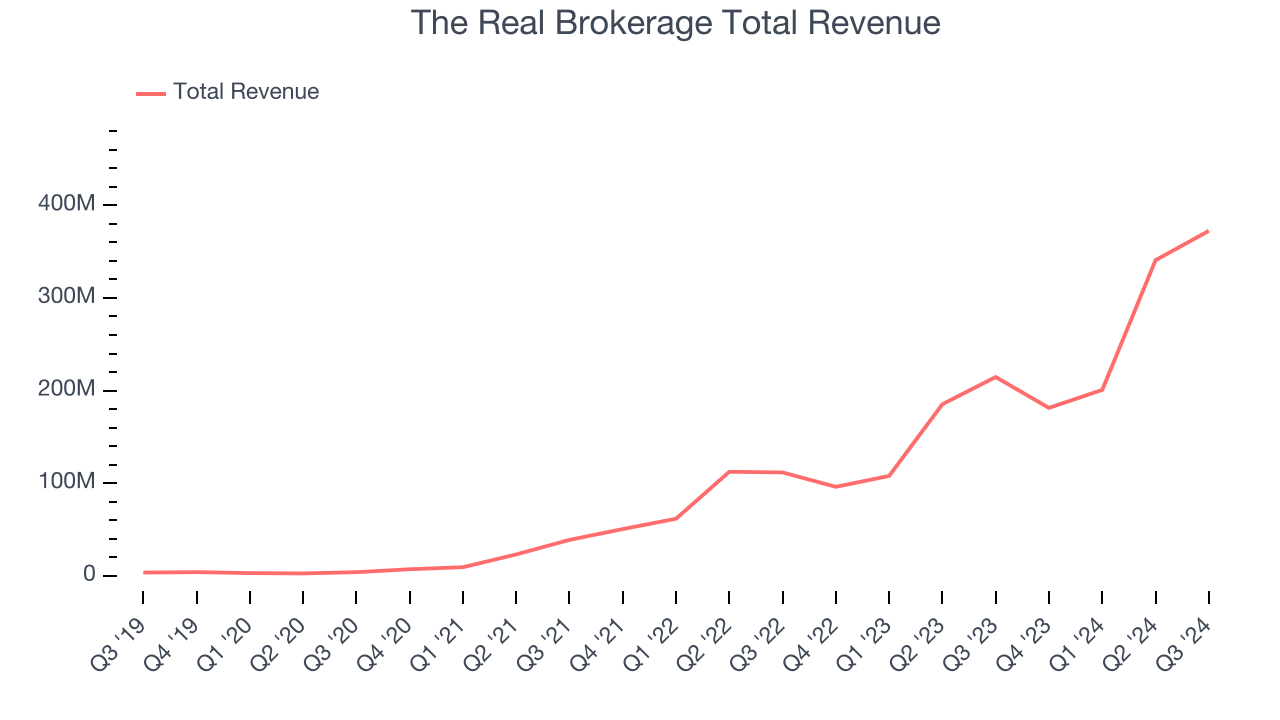
Long-term growth is the most important, but within consumer discretionary, product cycles are short and revenue can be hit-driven due to rapidly changing trends and consumer preferences. The Real Brokerage’s annualized revenue growth of 80.5% over the last two years is below its five-year trend, but we still think the results were good and suggest demand was strong. 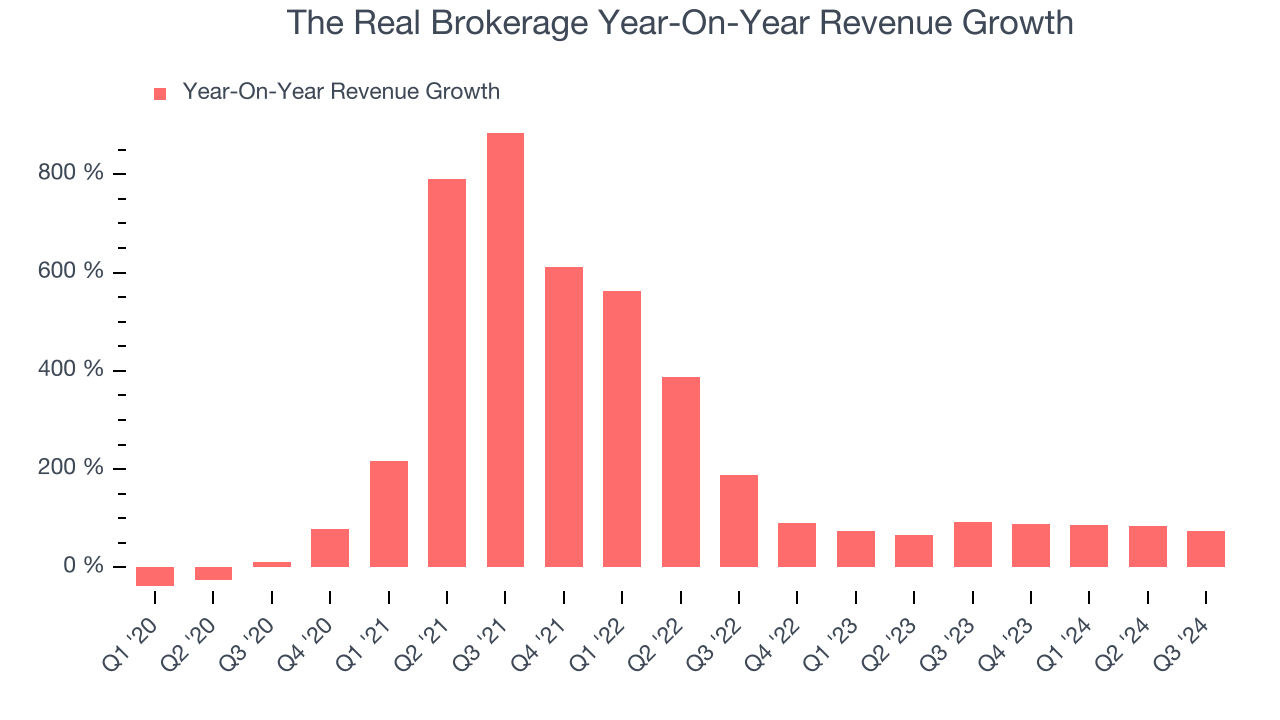
This quarter, The Real Brokerage reported magnificent year-on-year revenue growth of 73.5%, and its $372.5 million of revenue beat Wall Street’s estimates by 7.4%.
Looking ahead, sell-side analysts expect revenue to grow 28.6% over the next 12 months, a deceleration versus the last two years. Still, this projection is healthy and indicates the market is baking in success for its products and services.
When a company has more cash than it knows what to do with, buying back its own shares can make a lot of sense–as long as the price is right. Luckily, we’ve found one, a low-priced stock that is gushing free cash flow AND buying back shares. Click here to claim your Special Free Report on a fallen angel growth story that is already recovering from a setback.
Cash Is King
Free cash flow isn't a prominently featured metric in company financials and earnings releases, but we think it's telling because it accounts for all operating and capital expenses, making it tough to manipulate. Cash is king.
The Real Brokerage has shown poor cash profitability over the last two years, giving the company limited opportunities to return capital to shareholders. Its free cash flow margin averaged 3.4%, lousy for a consumer discretionary business.
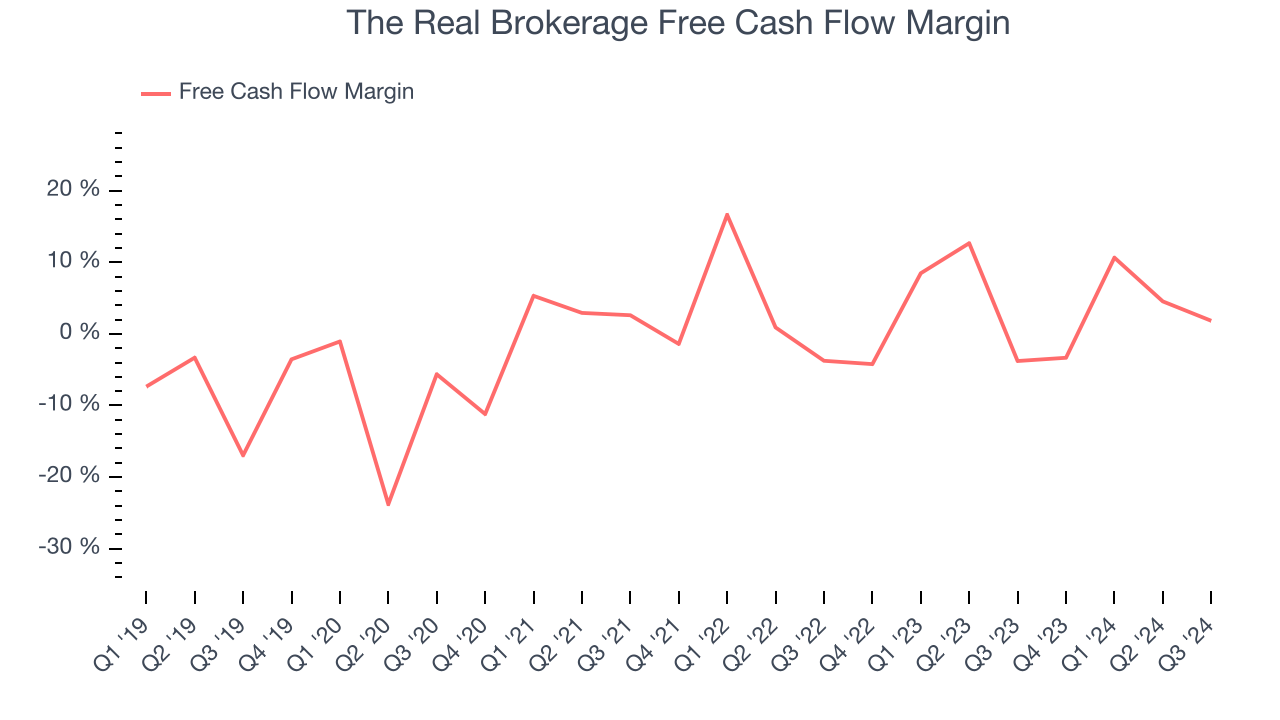
The Real Brokerage’s free cash flow clocked in at $6.83 million in Q3, equivalent to a 1.8% margin. Its cash flow turned positive after being negative in the same quarter last year, but we wouldn’t read too much into the short term because investment needs can be seasonal, leading to temporary swings. Long-term trends are more important.
Key Takeaways from The Real Brokerage’s Q3 Results
We were impressed by how significantly The Real Brokerage blew past analysts’ revenue, EPS, and EBITDA expectations. Zooming out, we think this was a solid quarter. The stock traded up 3.9% to $5.86 immediately following the results.
The Real Brokerage put up rock-solid earnings, but one quarter doesn’t necessarily make the stock a buy. Let’s see if this is a good investment. What happened in the latest quarter matters, but not as much as longer-term business quality and valuation, when deciding whether to invest in this stock. We cover that in our actionable full research report which you can read here, it’s free.