MRC Global trades at $13.33 and has moved in lockstep with the market. Its shares have returned 8.1% over the last six months while the S&P 500 has gained 10.6%.
Is there a buying opportunity in MRC Global, or does it present a risk to your portfolio? See what our analysts have to say in our full research report, it’s free.We're sitting this one out for now. Here are three reasons why MRC doesn't excite us and a stock we'd rather own.
Why Do We Think MRC Global Will Underperform?
Producing bomb casings and tracks for vehicles during WWII, MRC (NYSE: MRC) offers pipes, valves, and fitting products for various industries.
1. Revenue Spiraling Downwards
Examining a company’s long-term performance can provide clues about its quality. Any business can put up a good quarter or two, but the best consistently grow over the long haul. Over the last five years, MRC Global’s demand was weak and its revenue declined by 3.9% per year. This was below our standards and signals it’s a low quality business. 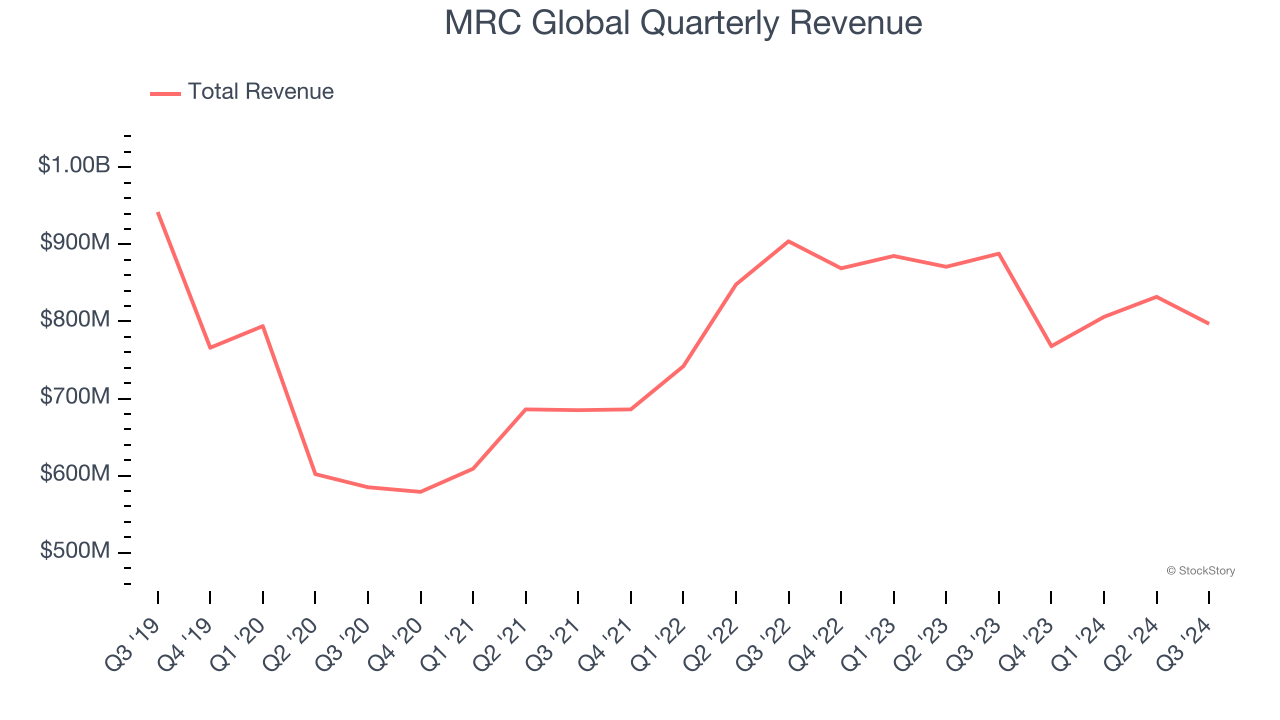
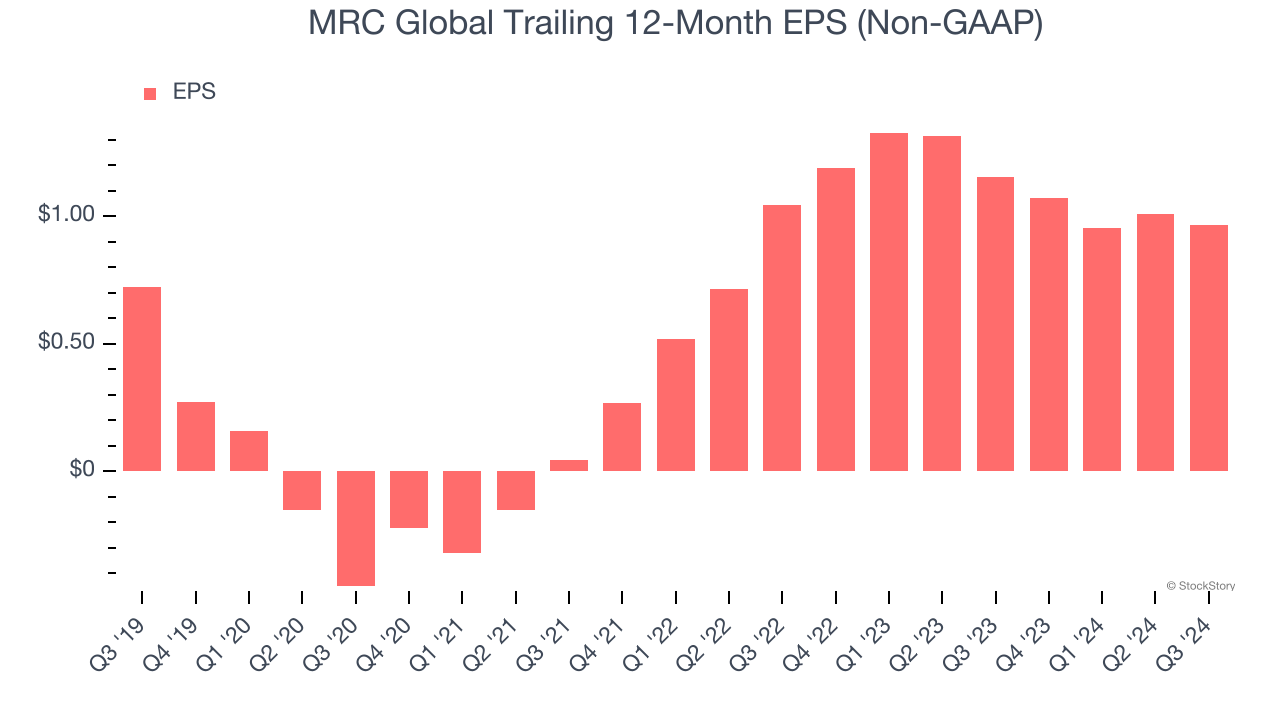
2. EPS Barely Growing
Analyzing the long-term change in earnings per share (EPS) shows whether a company's incremental sales were profitable – for example, revenue could be inflated through excessive spending on advertising and promotions.
MRC Global’s EPS grew at an unimpressive 6% compounded annual growth rate over the last five years. On the bright side, this performance was better than its 3.9% annualized revenue declines and tells us management adapted its cost structure in response to a challenging demand environment.
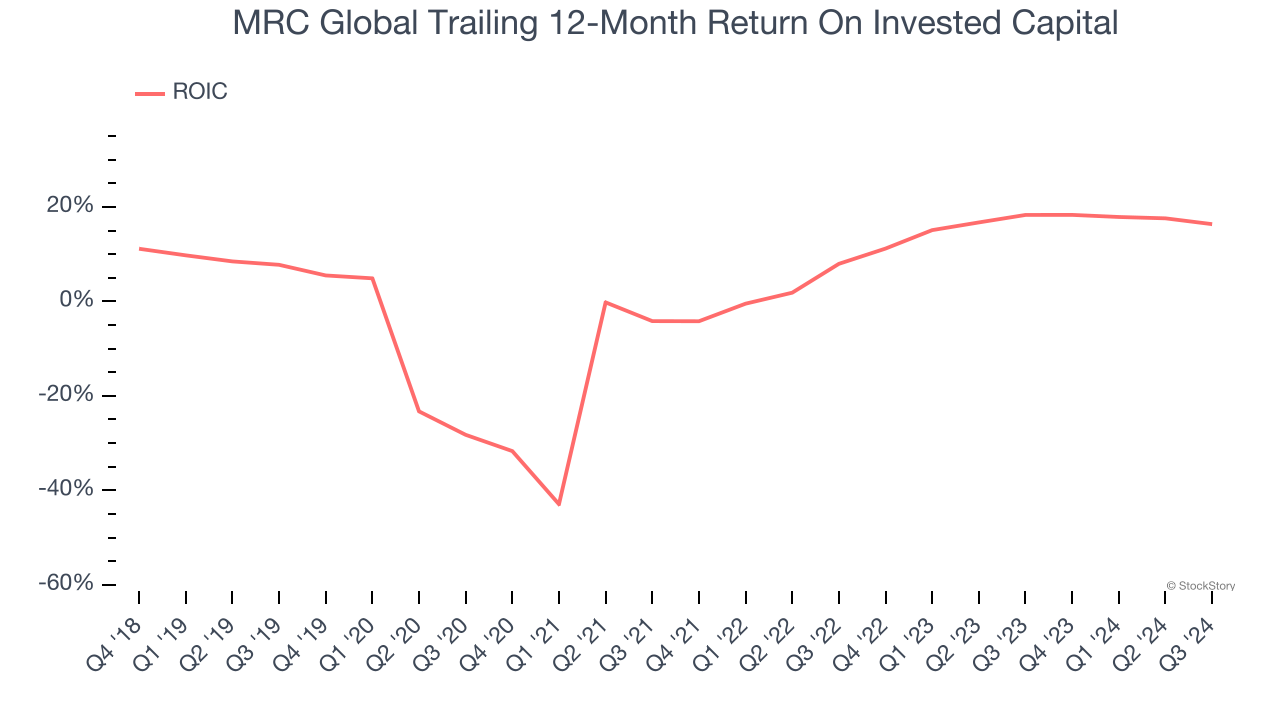
3. Previous Growth Initiatives Haven’t Paid Off Yet
Growth gives us insight into a company’s long-term potential, but how capital-efficient was that growth? Enter ROIC, a metric showing how much operating profit a company generates relative to the money it has raised (debt and equity).
MRC Global historically did a mediocre job investing in profitable growth initiatives. Its five-year average ROIC was 2%, lower than the typical cost of capital (how much it costs to raise money) for industrials companies.
Final Judgment
MRC Global falls short of our quality standards. That said, the stock currently trades at 11.9× forward price-to-earnings (or $13.33 per share). While this valuation is reasonable, we don’t see a big opportunity at the moment. There are better stocks to buy right now. Let us point you toward Yum! Brands, an all-weather company that owns household favorite Taco Bell.
Stocks We Would Buy Instead of MRC Global
The elections are now behind us. With rates dropping and inflation cooling, many analysts expect a breakout market to cap off the year - and we’re zeroing in on the stocks that could benefit immensely.
Take advantage of the rebound by checking out our Top 5 Strong Momentum Stocks for this week. This is a curated list of our High Quality stocks that have generated a market-beating return of 175% over the last five years.
Stocks that made our list in 2019 include now familiar names such as Nvidia (+2,691% between September 2019 and September 2024) as well as under-the-radar businesses like United Rentals (+550% five-year return). Find your next big winner with StockStory today for free.