PTC trades at $199 per share and has stayed right on track with the overall market, gaining 15.2% over the last six months. At the same time, the S&P 500 has returned 10.6%.
Is PTC a buy right now? Find out in our full research report, it’s free.
Why Does PTC Stock Spark Debate?
Used to design the Airbus A380 and Boeing 787 Dreamliner commercial airplanes, PTC’s (NASDAQ: PTC) software-as-service platform helps engineers and designers create and test products before manufacturing.
Two Things to Like:
1. ARR Growth Powers Predictable Revenues
While reported revenue for a software company can include low-margin items like implementation fees, annual recurring revenue (ARR) is a sum of the next 12 months of contracted revenue purely from software subscriptions, or the high-margin, predictable revenue streams that make SaaS businesses so valuable.
PTC’s ARR punched in at $2.25 billion in Q3, and over the last four quarters, its year-on-year growth averaged 14.7%. This performance was solid, reflecting the company’s ability to maintain strong customer relationships and secure longer-term commitments. Its growth also contributes positively to PTC’s predictability and valuation, as investors typically prefer businesses with recurring revenue. 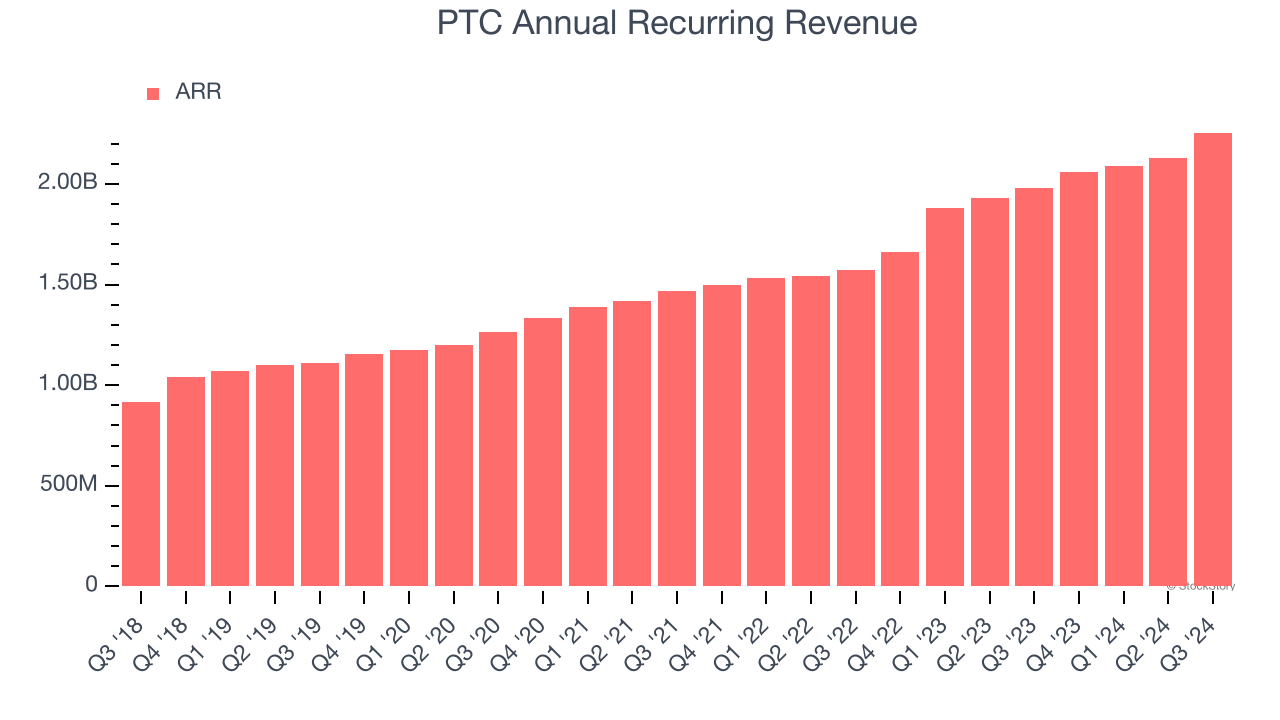
2. Excellent Free Cash Flow Margin Boosts Reinvestment Potential
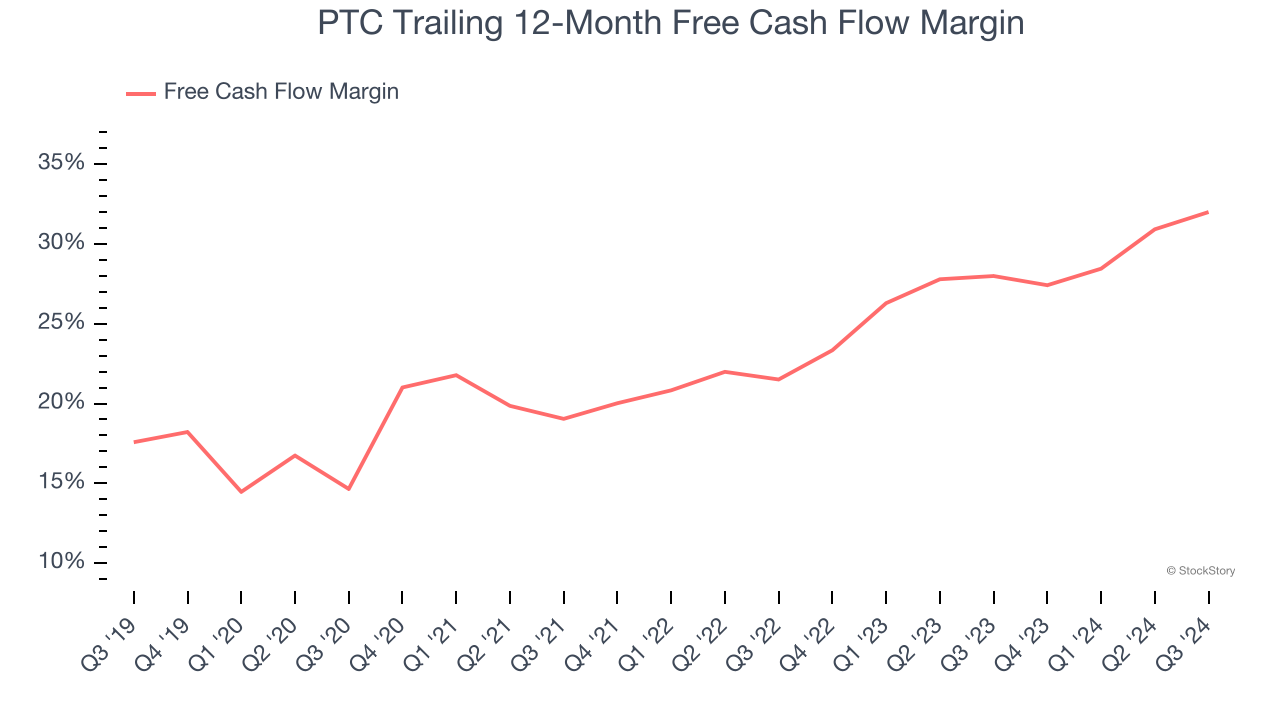
Free cash flow isn't a prominently featured metric in company financials and earnings releases, but we think it's telling because it accounts for all operating and capital expenses, making it tough to manipulate. Cash is king.
PTC has shown terrific cash profitability, driven by its lucrative business model and cost-effective customer acquisition strategy that enable it to stay ahead of the competition through investments in new products rather than sales and marketing. The company’s free cash flow margin was among the best in the software sector, averaging an eye-popping 32% over the last year.
One Reason to be Careful:
Long-Term Revenue Growth Disappoints
A company’s long-term performance is an indicator of its overall quality. While any business can experience short-term success, top-performing ones enjoy sustained growth for years. Regrettably, PTC’s sales grew at a sluggish 8.3% compounded annual growth rate over the last three years. This fell short of our benchmark for the software sector. 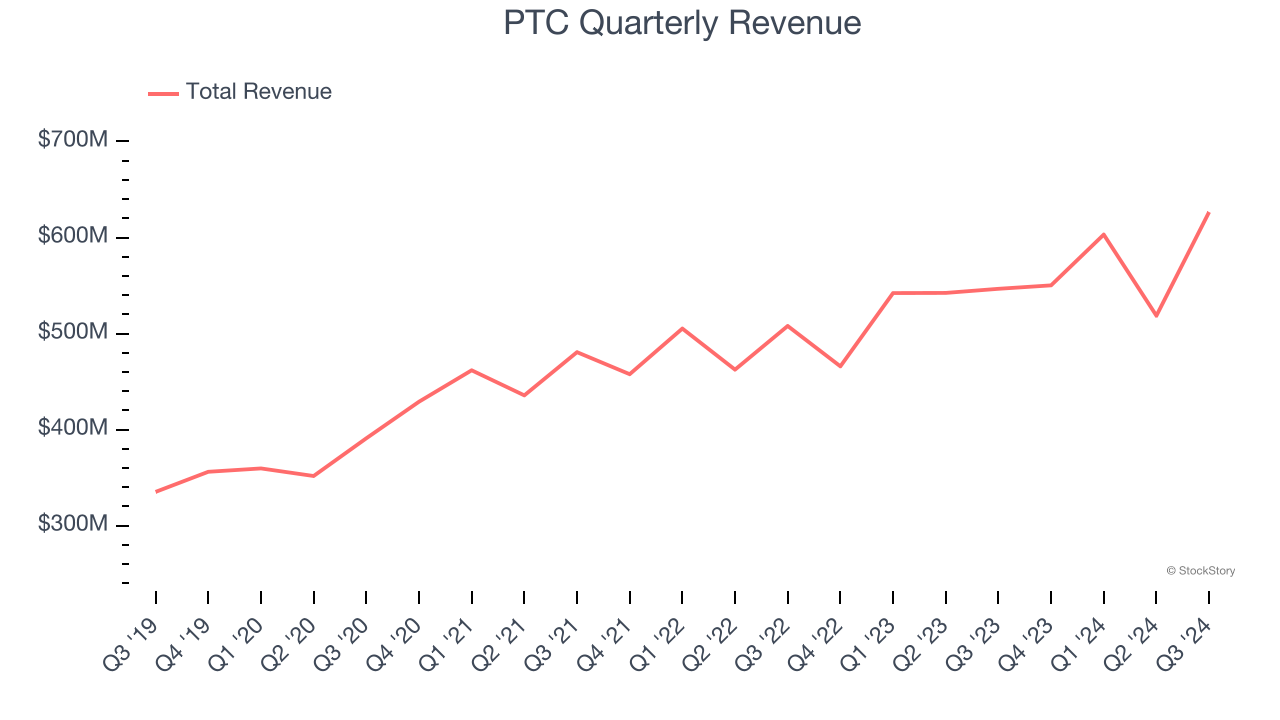
Final Judgment
PTC’s merits more than compensate for its flaws, but at $199 per share (or 9.6× forward price-to-sales), is now the time to initiate a position? See for yourself in our full research report, it’s free.
Stocks We Like Even More Than PTC
With rates dropping, inflation stabilizing, and the elections in the rearview mirror, all signs point to the start of a new bull run - and we’re laser-focused on finding the best stocks for this upcoming cycle.
Put yourself in the driver’s seat by checking out our Top 6 Stocks for this week. This is a curated list of our High Quality stocks that have generated a market-beating return of 175% over the last five years.
Stocks that made our list in 2019 include now familiar names such as Nvidia (+2,691% between September 2019 and September 2024) as well as under-the-radar businesses like Comfort Systems (+783% five-year return). Find your next big winner with StockStory today for free.


