Looking back on leisure products stocks’ Q3 earnings, we examine this quarter’s best and worst performers, including Solo Brands (NYSE: DTC) and its peers.
Leisure products cover a wide range of goods in the consumer discretionary sector. Maintaining a strong brand is key to success, and those who differentiate themselves will enjoy customer loyalty and pricing power while those who don’t may find themselves in precarious positions due to the non-essential nature of their offerings.
The 14 leisure products stocks we track reported a slower Q3. As a group, revenues beat analysts’ consensus estimates by 0.6% while next quarter’s revenue guidance was 1.1% below.
In light of this news, share prices of the companies have held steady. On average, they are relatively unchanged since the latest earnings results.
Solo Brands (NYSE: DTC)
Started through a Kickstarter campaign, Solo Brands (NYSE: DTC) is a provider of outdoor and recreational products.
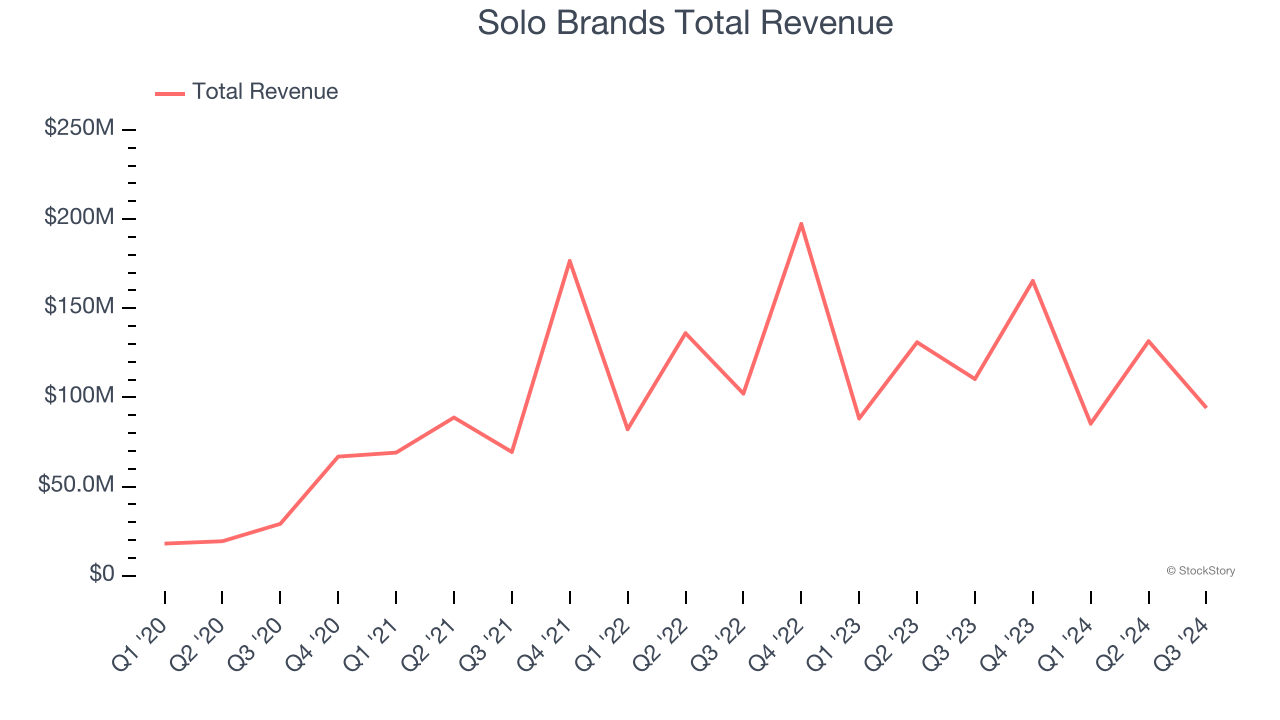
Solo Brands reported revenues of $94.14 million, down 14.7% year on year. This print exceeded analysts’ expectations by 1.7%. Despite the top-line beat, it was still a mixed quarter for the company with an impressive beat of analysts’ adjusted operating income estimates but a significant miss of analysts’ EPS estimates.
"Our third quarter results were in line with our expectations despite a continued challenging macroeconomic backdrop for big ticket consumer durable items," said Chris Metz, Chief Executive Officer of Solo Brands.

Unsurprisingly, the stock is down 22.3% since reporting and currently trades at $1.13.
Is now the time to buy Solo Brands? Access our full analysis of the earnings results here, it’s free.
Best Q3: American Outdoor Brands (NASDAQ: AOUT)
Spun off from Smith and Wesson in 2020, American Outdoor Brands (NASDAQ: AOUT) is an outdoor and recreational products company that offers firearms and firearm accessories.
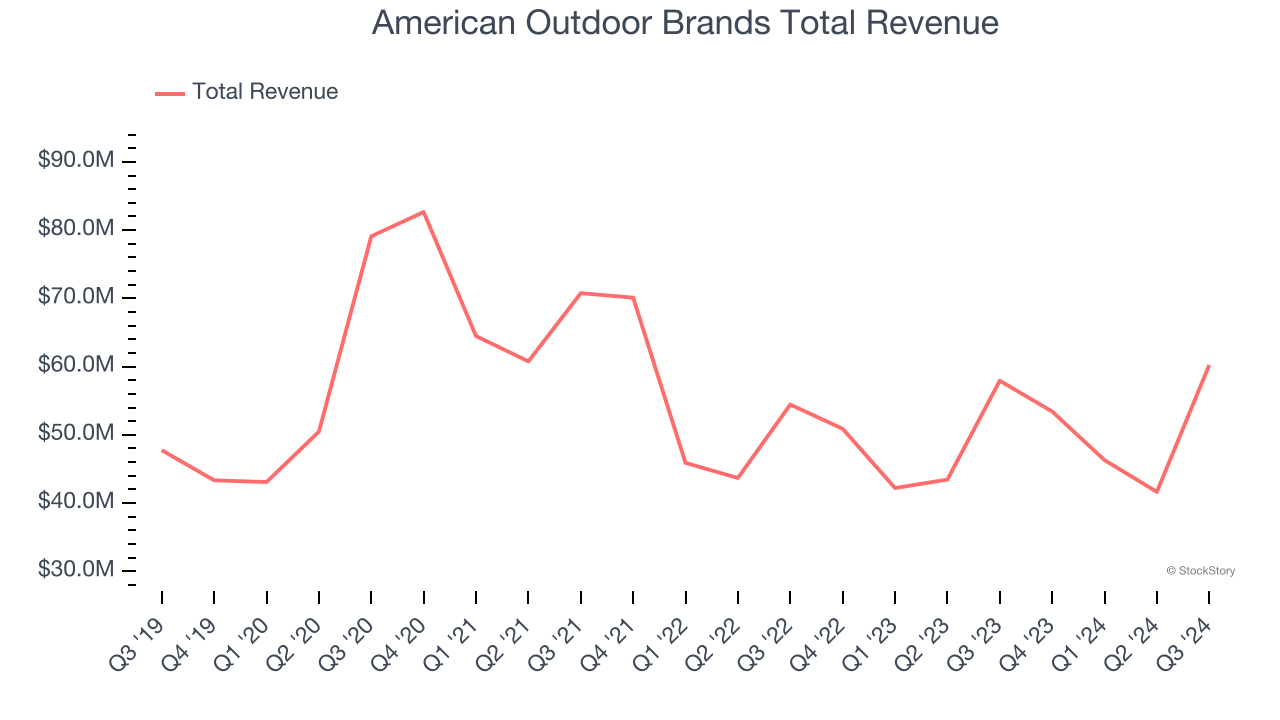
American Outdoor Brands reported revenues of $60.23 million, up 4% year on year, outperforming analysts’ expectations by 13.1%. The business had an incredible quarter with a solid beat of analysts’ EPS estimates and an impressive beat of analysts’ EBITDA estimates.

American Outdoor Brands delivered the highest full-year guidance raise among its peers. The market seems happy with the results as the stock is up 33.4% since reporting. It currently trades at $14.54.
Is now the time to buy American Outdoor Brands? Access our full analysis of the earnings results here, it’s free.
Weakest Q3: Johnson Outdoors (NASDAQ: JOUT)
Operating in locations worldwide, Johnson Outdoors (NASDAQ: JOUT) specializes in innovative outdoor recreational products for adventurers worldwide.
Johnson Outdoors reported revenues of $105.9 million, up 9.9% year on year, falling short of analysts’ expectations by 7.9%. It was a disappointing quarter as it posted a significant miss of analysts’ EPS estimates.
Interestingly, the stock is up 7.6% since the results and currently trades at $37.20.
Read our full analysis of Johnson Outdoors’s results here.
Acushnet (NYSE: GOLF)
Producer of the acclaimed Titleist Pro V1 golf ball, Acushnet (NYSE: GOLF) is a design and manufacturing company specializing in performance-driven golf products.
Acushnet reported revenues of $620.5 million, up 4.6% year on year. This result met analysts’ expectations. Overall, it was a strong quarter as it also logged a solid beat of analysts’ adjusted operating income estimates.
The stock is up 14% since reporting and currently trades at $72.22.
Read our full, actionable report on Acushnet here, it’s free.
Brunswick (NYSE: BC)
Formerly known as Brunswick-Balke-Collender Company, Brunswick (NYSE: BC) is a designer and manufacturer of recreational marine products, including boats, engines, and marine parts.
Brunswick reported revenues of $1.27 billion, down 20.1% year on year. This print missed analysts’ expectations by 1.3%. It was a softer quarter as it also produced full-year EPS guidance missing analysts’ expectations.
The stock is down 6% since reporting and currently trades at $72.41.
Read our full, actionable report on Brunswick here, it’s free.
Market Update
In response to the Fed's rate hikes in 2022 and 2023, inflation has been gradually trending down from its post-pandemic peak, trending closer to the Fed's 2% target. Despite higher borrowing costs, the economy has avoided flashing recessionary signals. This is the much-desired soft landing that many investors hoped for. The recent rate cuts (0.5% in September and 0.25% in November 2024) have bolstered the stock market, making 2024 a strong year for equities. Donald Trump’s presidential win in November sparked additional market gains, sending indices to record highs in the days following his victory. However, debates continue over possible tariffs and corporate tax adjustments, raising questions about economic stability in 2025.
Want to invest in winners with rock-solid fundamentals? Check out our Hidden Gem Stocks and add them to your watchlist. These companies are poised for growth regardless of the political or macroeconomic climate.
Join Paid Stock Investor Research
Help us make StockStory more helpful to investors like yourself. Join our paid user research session and receive a $50 Amazon gift card for your opinions. Sign up here.


