The past six months have been a windfall for Brinker International’s shareholders. The company’s stock price has jumped 93.5%, setting a new 52-week high of $132.60 per share. This was partly thanks to its solid quarterly results, and the run-up might have investors contemplating their next move.
Is there a buying opportunity in Brinker International, or does it present a risk to your portfolio? Dive into our full research report to see our analyst team’s opinion, it’s free.We’re glad investors have benefited from the price increase, but we're swiping left on Brinker International for now. Here are three reasons why you should be careful with EAT and a stock we'd rather own.
Why Is Brinker International Not Exciting?
Founded by Norman Brinker in Dallas, Texas, Brinker International (NYSE: EAT) is a casual restaurant chain that operates under the Chili’s, Maggiano’s Little Italy, and It’s Just Wings banners.
1. Lack of New Restaurants, a Headwind for Revenue
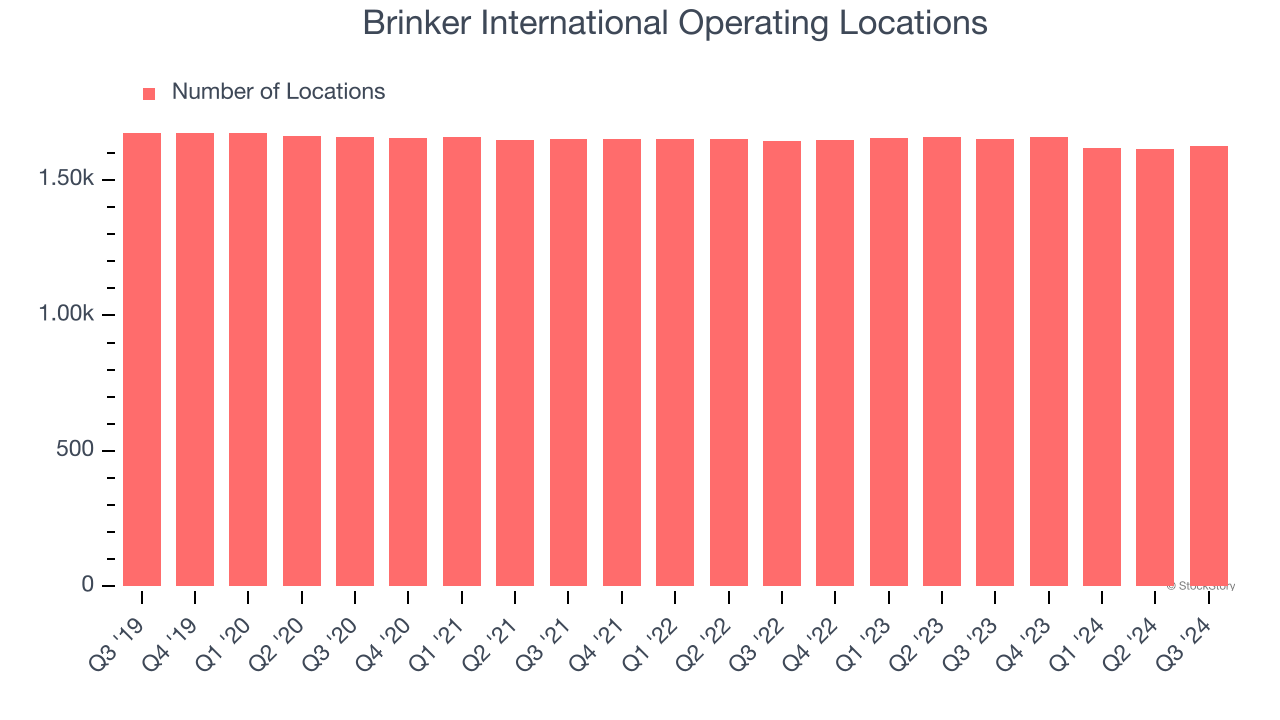
A restaurant chain’s total number of dining locations influences how much it can sell and how quickly revenue can grow.
Brinker International operated 1,625 locations in the latest quarter, and over the last two years, has kept its restaurant count flat while other restaurant businesses have opted for growth.
When a chain doesn’t open many new restaurants, it usually means there’s stable demand for its meals and it’s focused on improving operational efficiency to increase profitability.
2. Low Gross Margin Reveals Weak Structural Profitability
Gross profit margins tell us how much money a restaurant gets to keep after paying for the direct costs of the meals it sells, like ingredients, and indicate its level of pricing power.
Brinker International has bad unit economics for a restaurant company, signaling it operates in a competitive market and has little room for error if demand unexpectedly falls. As you can see below, it averaged a 14% gross margin over the last two years. Said differently, Brinker International had to pay a chunky $85.98 to its suppliers for every $100 in revenue. 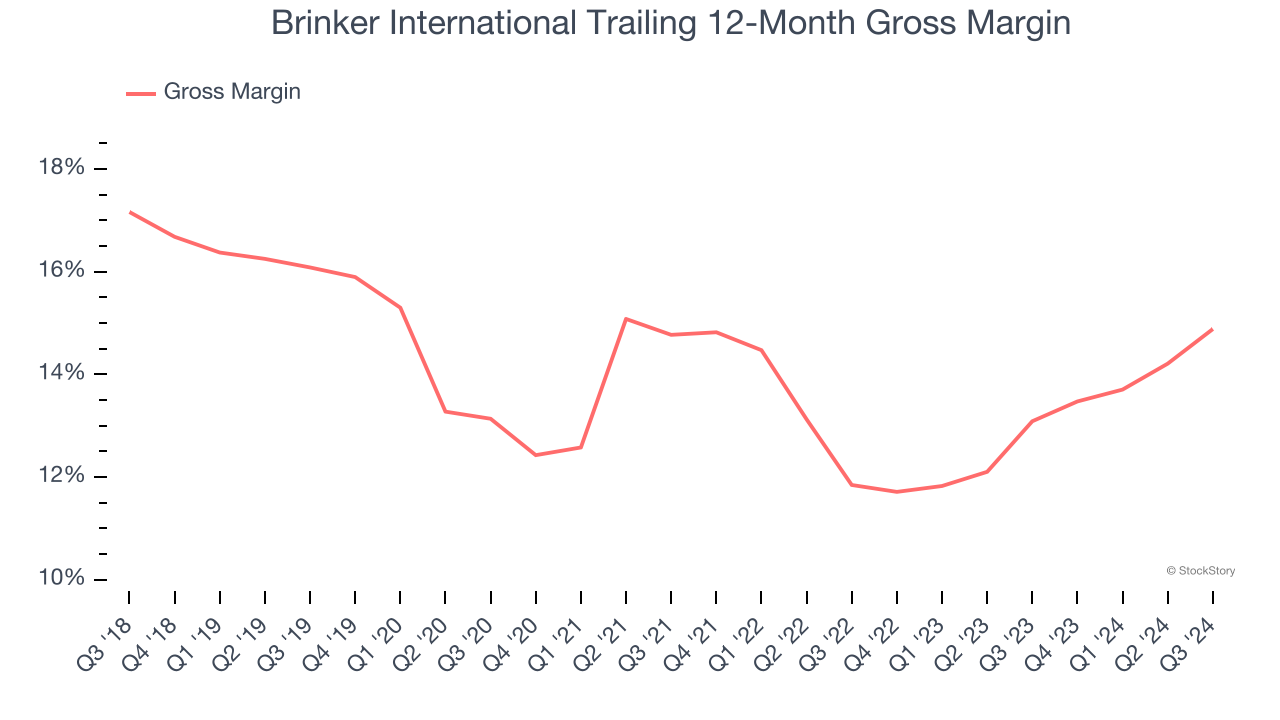
3. Weak Operating Margin Could Cause Trouble
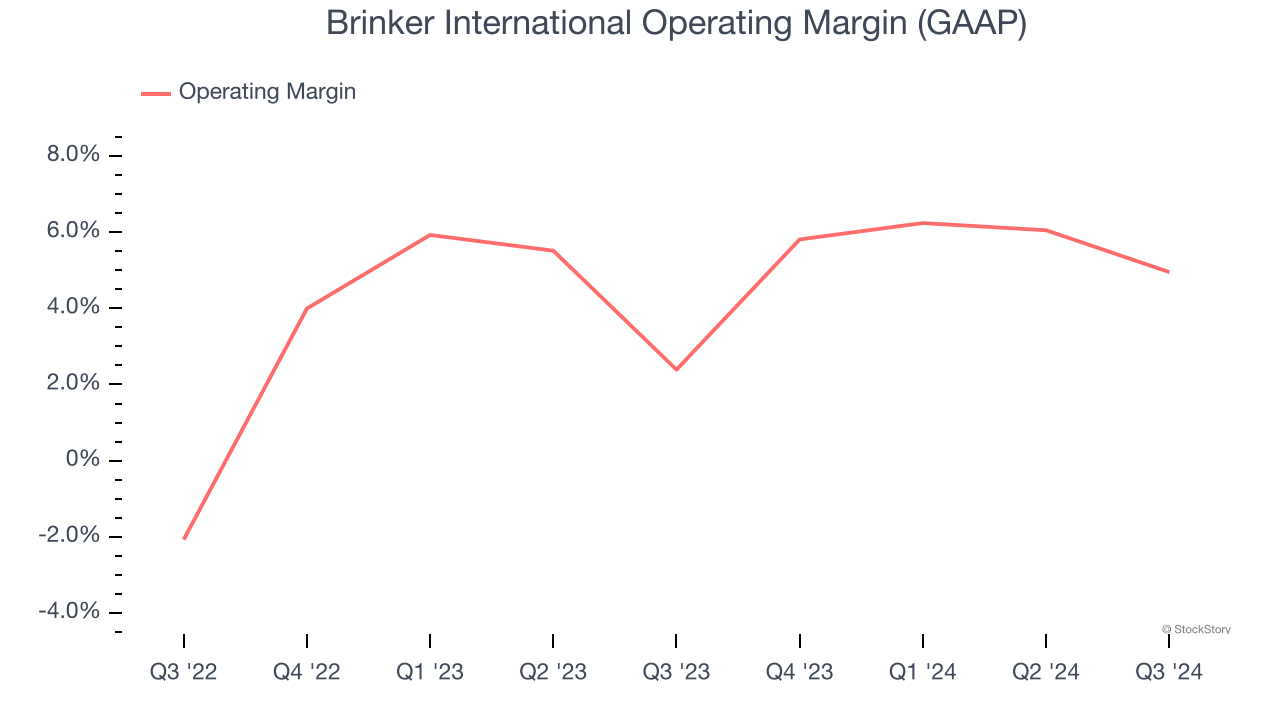
Operating margin is an important measure of profitability for restaurants as it accounts for all expenses keeping the lights on, including wages, rent, advertising, and other administrative costs.
Brinker International was profitable over the last two years but held back by its large cost base. Its average operating margin of 5.2% was weak for a restaurant business. This result isn’t too surprising given its low gross margin as a starting point.
Final Judgment
Brinker International isn’t a terrible business, but it doesn’t pass our bar. After the recent rally, the stock trades at 26.7× forward price-to-earnings (or $132.60 per share). This valuation tells us a lot of optimism is priced in - you can find better investment opportunities elsewhere. Let us point you toward Yum! Brands, an all-weather company that owns household favorite Taco Bell.
Stocks We Like More Than Brinker International
The elections are now behind us. With rates dropping and inflation cooling, many analysts expect a breakout market to cap off the year - and we’re zeroing in on the stocks that could benefit immensely.
Take advantage of the rebound by checking out our Top 5 Growth Stocks for this month. This is a curated list of our High Quality stocks that have generated a market-beating return of 175% over the last five years.
Stocks that made our list in 2019 include now familiar names such as Nvidia (+2,691% between September 2019 and September 2024) as well as under-the-radar businesses like Comfort Systems (+783% five-year return). Find your next big winner with StockStory today for free.