Earnings results often indicate what direction a company will take in the months ahead. With Q3 behind us, let’s have a look at Kontoor Brands (NYSE: KTB) and its peers.
Thanks to social media and the internet, not only are styles changing more frequently today than in decades past but also consumers are shifting the way they buy their goods, favoring omnichannel and e-commerce experiences. Some apparel and accessories companies have made concerted efforts to adapt while those who are slower to move may fall behind.
The 17 apparel and accessories stocks we track reported a mixed Q3. As a group, revenues along with next quarter’s revenue guidance were in line with analysts’ consensus estimates.
Luckily, apparel and accessories stocks have performed well with share prices up 13.2% on average since the latest earnings results.
Kontoor Brands (NYSE: KTB)
Founded in 2019 after separating from VF Corporation, Kontoor Brands (NYSE: KTB) is a clothing company known for its high-quality denim products.
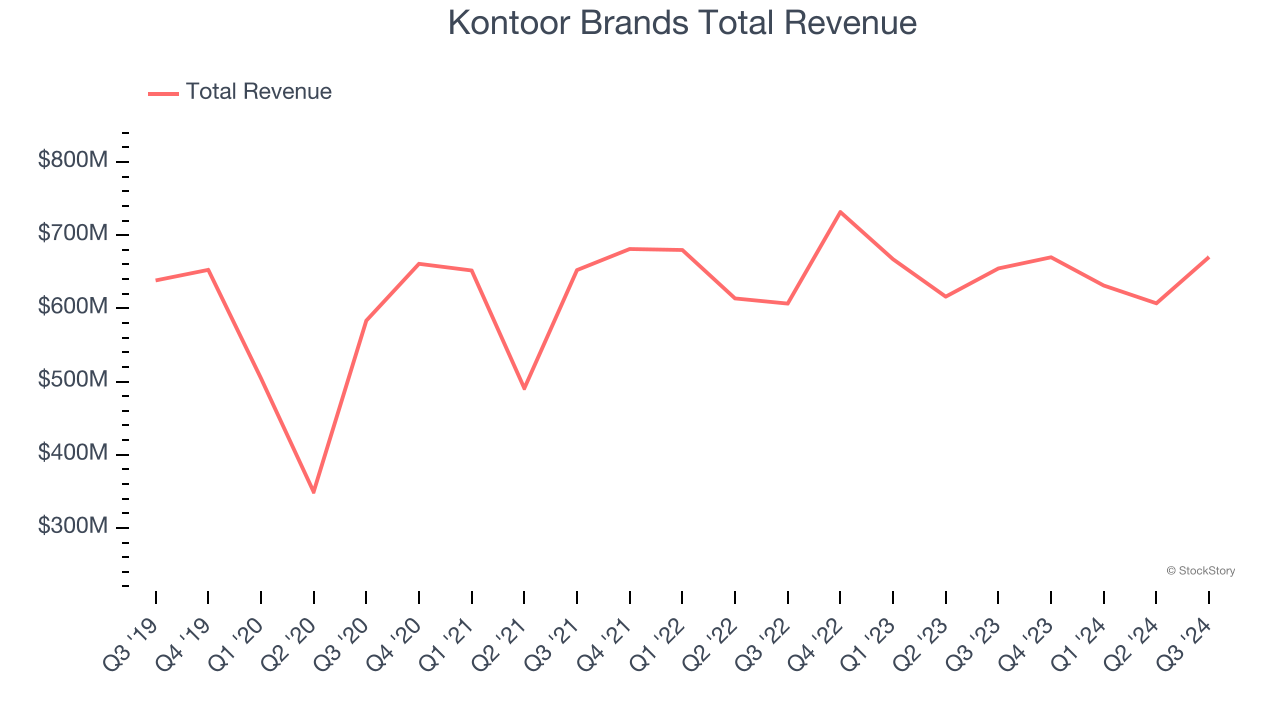
Kontoor Brands reported revenues of $670.2 million, up 2.4% year on year. This print exceeded analysts’ expectations by 1%. Overall, it was a satisfactory quarter for the company with a decent beat of analysts’ EPS estimates but full-year revenue guidance meeting analysts’ expectations.
“Our third quarter results exceeded expectations driven by strong execution and business fundamentals,” said Scott Baxter, President, Chief Executive Officer and Chair of Kontoor Brands.
Interestingly, the stock is up 12.4% since reporting and currently trades at $86.01.
Is now the time to buy Kontoor Brands? Access our full analysis of the earnings results here, it’s free.
Best Q3: Stitch Fix (NASDAQ: SFIX)
One of the original subscription box companies, Stitch Fix (NASDAQ: SFIX) is an online personal styling and fashion service that curates personalized clothing selections for customers.
Stitch Fix reported revenues of $318.8 million, down 12.6% year on year, outperforming analysts’ expectations by 3.9%. The business had an exceptional quarter with EBITDA guidance for next quarter exceeding analysts’ expectations and an impressive beat of analysts’ EPS estimates.
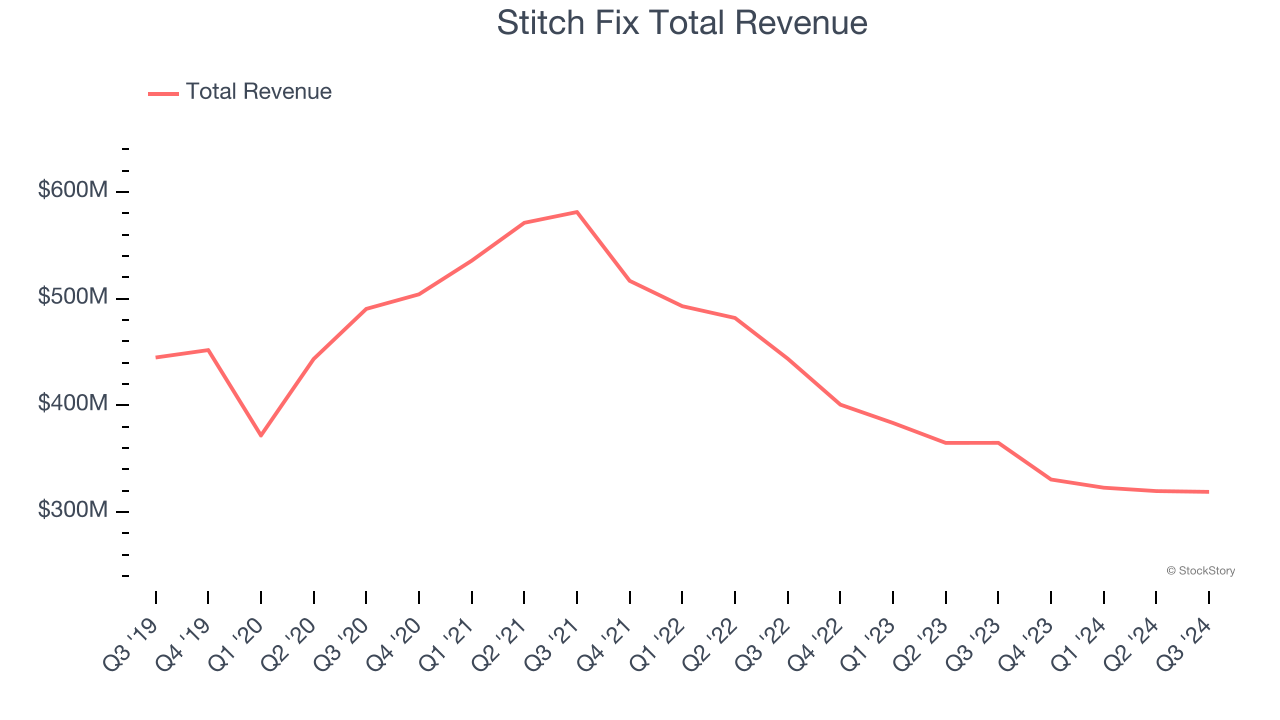
Stitch Fix delivered the biggest analyst estimates beat and highest full-year guidance raise among its peers. Although it had a fine quarter compared its peers, the market seems unhappy with the results as the stock is down 13% since reporting. It currently trades at $4.
Is now the time to buy Stitch Fix? Access our full analysis of the earnings results here, it’s free.
Weakest Q3: Figs (NYSE: FIGS)
Rising to fame via TikTok and founded in 2013 by Heather Hasson and Trina Spear, Figs (NYSE: FIGS) is a healthcare apparel company known for its stylish approach to medical attire and uniforms.
Figs reported revenues of $140.2 million, down 1.5% year on year, falling short of analysts’ expectations by 2.1%. It was a disappointing quarter as it posted a significant miss of analysts’ adjusted operating income estimates.
As expected, the stock is down 9.7% since the results and currently trades at $6.02.
Read our full analysis of Figs’s results here.
PVH (NYSE: PVH)
Founded in 1881 by a husband and wife duo, PVH (NYSE: PVH) is a global fashion conglomerate with iconic brands like Calvin Klein and Tommy Hilfiger.
PVH reported revenues of $2.26 billion, down 4.6% year on year. This print topped analysts’ expectations by 1.5%. Zooming out, it was a mixed quarter as it also recorded a solid beat of analysts’ adjusted operating income estimates but EPS guidance for next quarter missing analysts’ expectations significantly.
The stock is down 1.6% since reporting and currently trades at $111.03.
Read our full, actionable report on PVH here, it’s free.
ThredUp (NASDAQ: TDUP)
Founded to revolutionize thrifting, ThredUp (NASDAQ: TDUP) is a leading online fashion resale marketplace offering a wide selection of gently-used clothing and accessories.
ThredUp reported revenues of $73.02 million, down 11% year on year. This number surpassed analysts’ expectations by 3.8%. However, it was a slower quarter as it logged a miss of analysts’ orders estimates.
The stock is up 178% since reporting and currently trades at $1.47.
Read our full, actionable report on ThredUp here, it’s free.
Market Update
As a result of the Fed's rate hikes in 2022 and 2023, inflation has come down from frothy levels post-pandemic. The general rise in the price of goods and services is trending towards the Fed's 2% goal as of late, which is good news. The higher rates that fought inflation also didn't slow economic activity enough to catalyze a recession. So far, soft landing. This, combined with recent rate cuts (half a percent in September 2024 and a quarter percent in November 2024) have led to strong stock market performance in 2024. The icing on the cake for 2024 returns was Donald Trump's victory in the US Presidential Election in early November, sending major indices to all-time highs in the week following the election. Still, debates around the health of the economy and the impact of potential tariffs and corporate tax cuts remain. Said differently, there's still much uncertainty around 2025.
Want to invest in winners with rock-solid fundamentals? Check out our Strong Momentum Stocks and add them to your watchlist. These companies are poised for growth regardless of the political or macroeconomic climate.
Join Paid Stock Investor Research
Help us make StockStory more helpful to investors like yourself. Join our paid user research session and receive a $50 Amazon gift card for your opinions. Sign up here.