B&G Foods has gotten torched over the last six months - since June 2024, its stock price has dropped 29.7% to $6.74 per share. This was partly due to its softer quarterly results and may have investors wondering how to approach the situation.
Is now the time to buy B&G Foods, or should you be careful about including it in your portfolio? See what our analysts have to say in our full research report, it’s free.Even with the cheaper entry price, we don't have much confidence in B&G Foods. Here are three reasons why we avoid BGS and a stock we'd rather own.
Why Do We Think B&G Foods Will Underperform?
Started as a small grocery store in New York City, B&G Foods (NYSE: BGS) is an American packaged foods company with a diverse portfolio of more than 50 brands.
1. Long-Term Revenue Growth Flatter Than a Pancake
A company’s long-term sales performance signals its overall quality. Even a bad business can shine for one or two quarters, but a top-tier one grows for years. Unfortunately, B&G Foods struggled to consistently increase demand as its $1.96 billion of sales for the trailing 12 months was close to its revenue three years ago. This fell short of our benchmarks and signals it’s a low quality business. 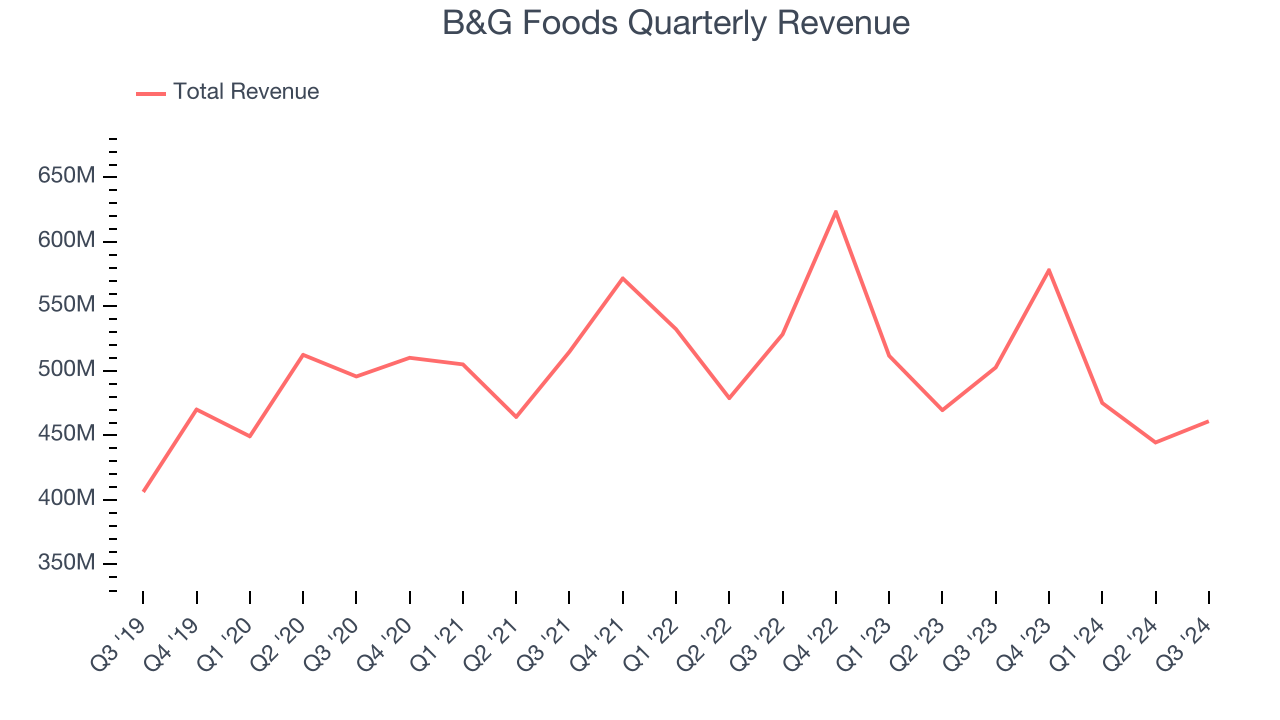
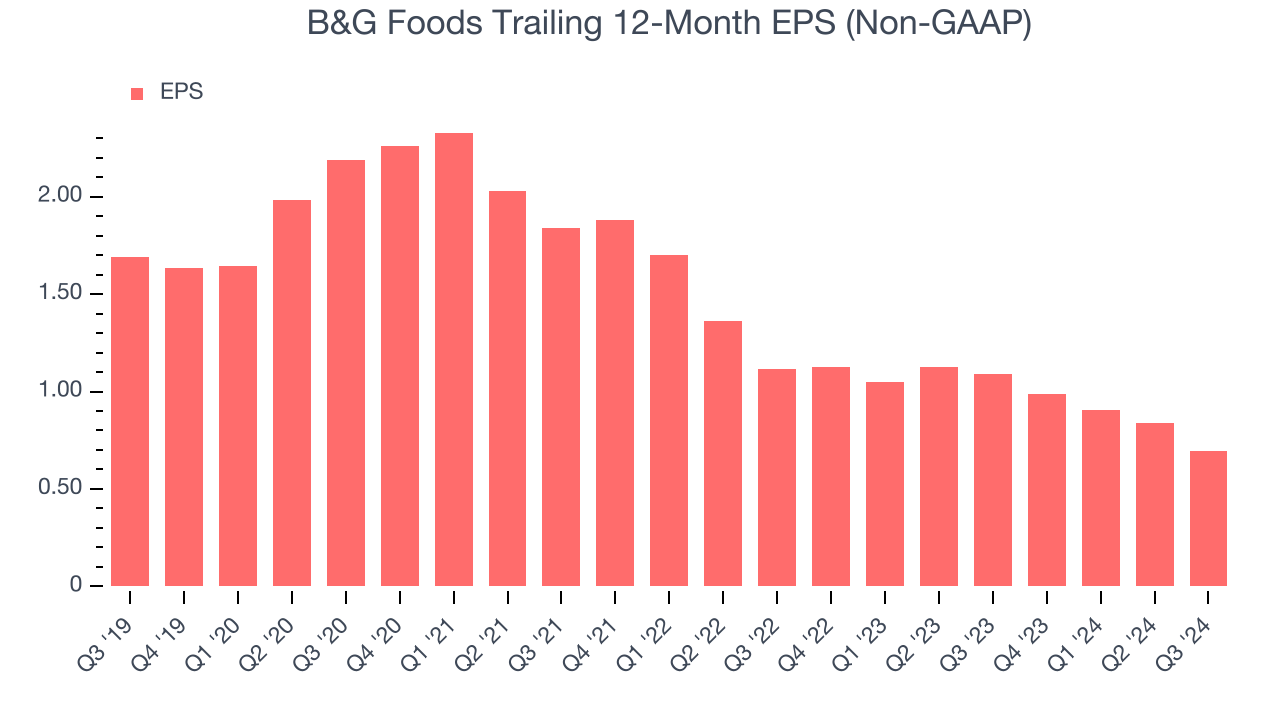
2. EPS Trending Down
Analyzing the change in earnings per share (EPS) shows whether a company's incremental sales were profitable – for example, revenue could be inflated through excessive spending on advertising and promotions.
Sadly for B&G Foods, its EPS declined by 27.8% annually over the last three years while its revenue was flat. This tells us the company struggled because its fixed cost base made it difficult to adjust to choppy demand.
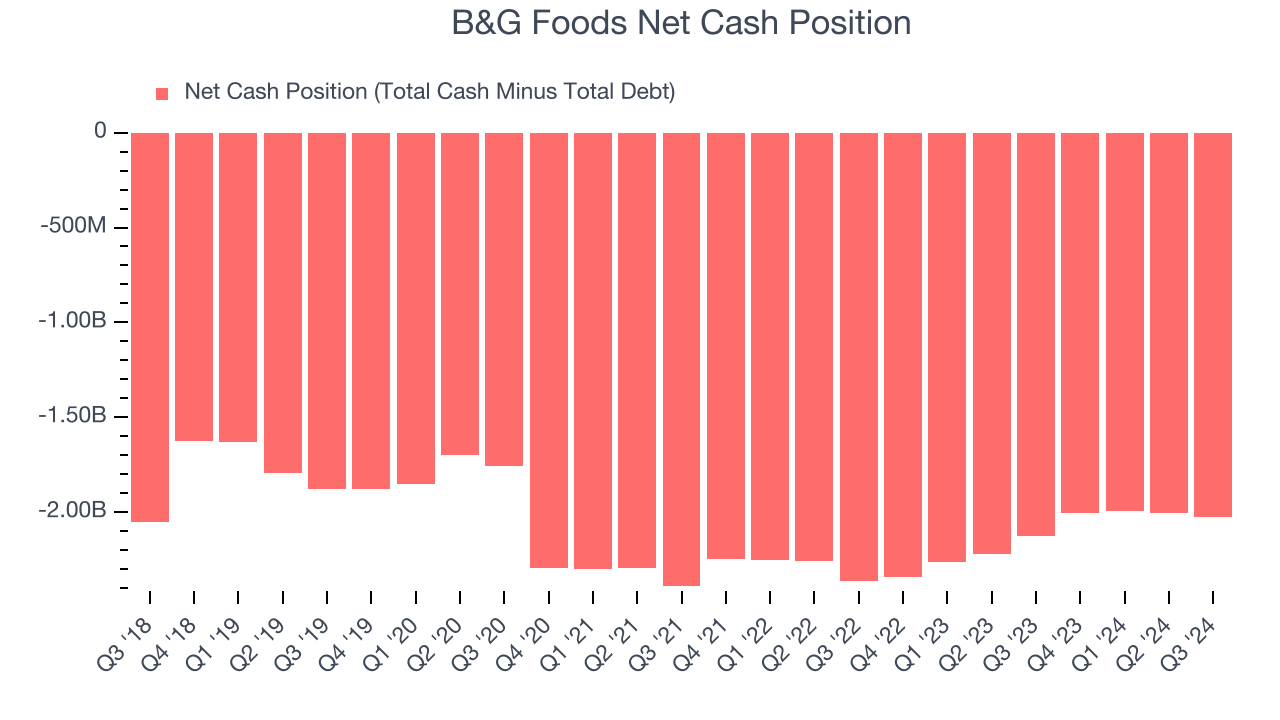
3. High Debt Levels Increase Risk
Debt is a tool that can boost company returns but presents risks if used irresponsibly. As long-term investors, we aim to avoid companies taking excessive advantage of this instrument because it could lead to insolvency.
B&G Foods’s $2.08 billion of debt exceeds the $54.69 million of cash on its balance sheet. Furthermore, its 7x net-debt-to-EBITDA ratio (based on its EBITDA of $296.1 million over the last 12 months) shows the company is overleveraged.
At this level of debt, incremental borrowing becomes increasingly expensive and credit agencies could downgrade the company’s rating if profitability falls. B&G Foods could also be backed into a corner if the market turns unexpectedly – a situation we seek to avoid as investors in high-quality companies.
We hope B&G Foods can improve its balance sheet and remain cautious until it increases its profitability or pays down its debt.
Final Judgment
B&G Foods falls short of our quality standards. Following the recent decline, the stock trades at 8.7x forward price-to-earnings (or $6.74 per share). While this valuation is optically cheap, the potential downside is still huge given its shaky fundamentals. There are more exciting stocks to buy at the moment. We’d recommend looking at Wabtec, a leading provider of locomotive services benefiting from an upgrade cycle.
Stocks We Like More Than B&G Foods
The Trump trade may have passed, but rates are still dropping and inflation is still cooling. Opportunities are ripe for those ready to act - and we’re here to help you pick them.
Get started by checking out our Top 5 Strong Momentum Stocks for this week. This is a curated list of our High Quality stocks that have generated a market-beating return of 175% over the last five years.
Stocks that made our list in 2019 include now familiar names such as Nvidia (+2,691% between September 2019 and September 2024) as well as under-the-radar businesses like United Rentals (+550% five-year return). Find your next big winner with StockStory today for free.