Calavo trades at $28.29 per share and has stayed right on track with the overall market, gaining 9.5% over the last six months. At the same time, the S&P 500 has returned 14%.
Is there a buying opportunity in Calavo, or does it present a risk to your portfolio? Dive into our full research report to see our analyst team’s opinion, it’s free.We're cautious about Calavo. Here are three reasons why there are better opportunities than CVGW and a stock we'd rather own.
Why Do We Think Calavo Will Underperform?
A trailblazer in the avocado industry, Calavo Growers (NASDAQ: CVGW) is a pioneering California-based provider of high-quality avocados and other fresh food products.
1. Revenue Spiraling Downwards
A company’s long-term performance is an indicator of its overall quality. While any business can experience short-term success, top-performing ones enjoy sustained growth for years. Calavo’s demand was weak over the last three years as its sales fell at a 10.3% annual rate. This fell short of our benchmarks and is a sign of poor business quality. 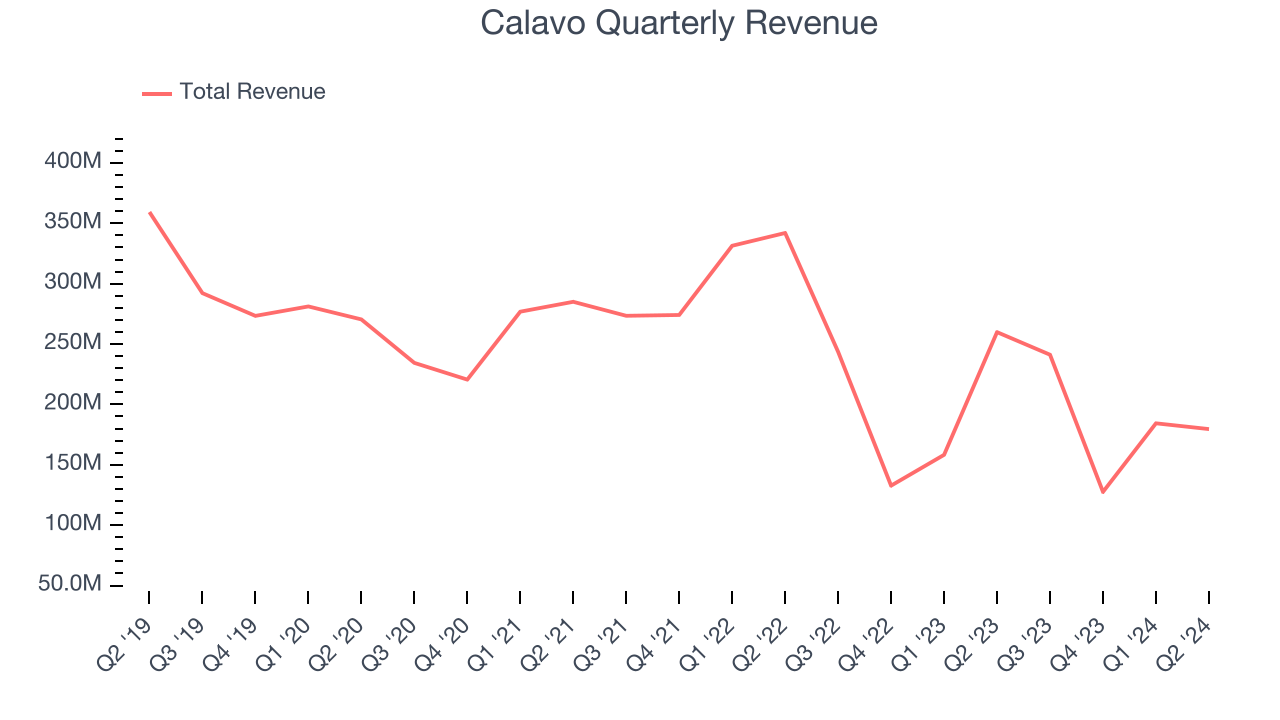
2. Revenue Projections Show Stormy Skies Ahead
Forecasted revenues by Wall Street analysts signal a company’s potential. Predictions may not always be accurate, but accelerating growth typically boosts valuation multiples and stock prices while slowing growth does the opposite.
Over the next 12 months, sell-side analysts expect Calavo’s revenue to drop by 11%, close to its 10.3% annualized declines for the past three years. This projection doesn't excite us and suggests its newer products will not accelerate its top-line performance yet.
3. Low Gross Margin Reveals Weak Structural Profitability
All else equal, we prefer higher gross margins because they make it easier to generate more operating profits and indicate that a company commands pricing power by offering more differentiated products.
Calavo has poor unit economics for a consumer staples company, signaling it operates in a competitive market and lacks pricing power because its products can be substituted. As you can see below, it averaged a 9.3% gross margin over the last two years. That means Calavo paid its suppliers a lot of money ($90.67 for every $100 in revenue) to run its business. 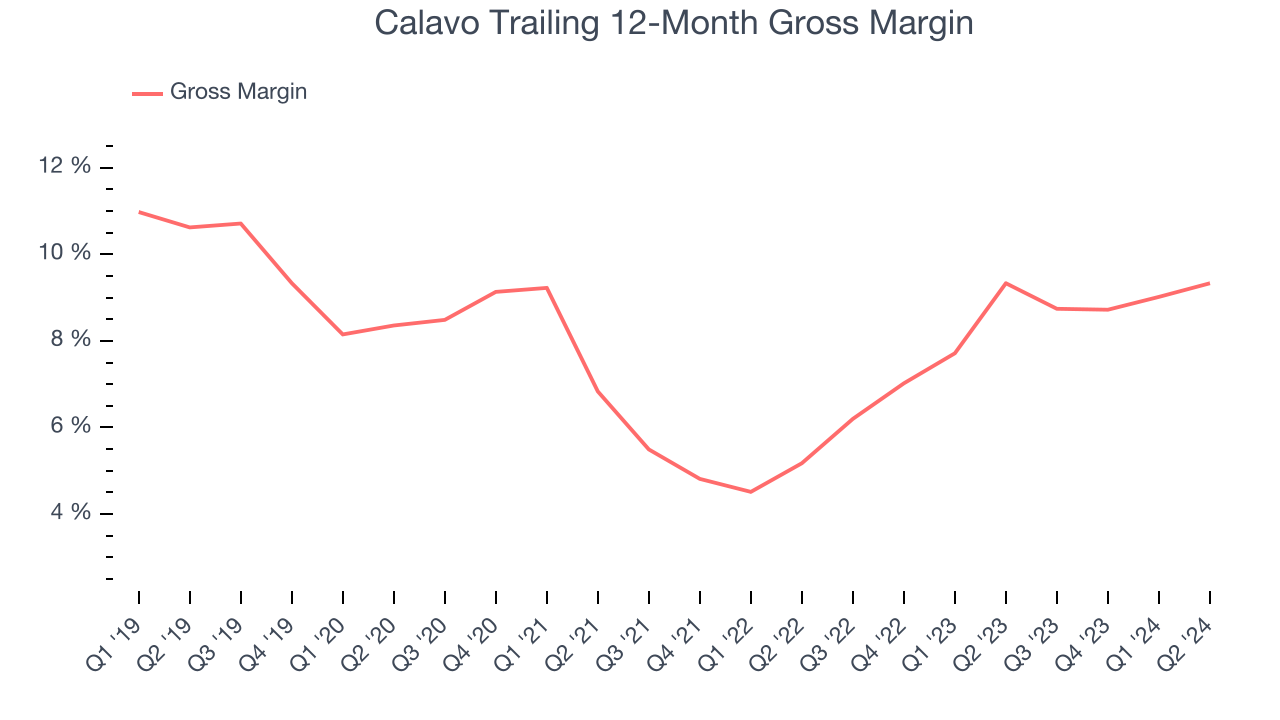
Final Judgment
Calavo falls short of our quality standards. That said, the stock currently trades at 16.7x forward price-to-earnings (or $28.29 per share). This valuation tells us it’s a bit of a market darling with a lot of good news priced in - we think there are better stocks to buy right now. We’d suggest looking at Yum! Brands, an all-weather company that owns household favorite Taco Bell.
Stocks We Would Buy Instead of Calavo
The Trump trade may have passed, but rates are still dropping and inflation is still cooling. Opportunities are ripe for those ready to act - and we’re here to help you pick them.
Get started by checking out our Top 9 Market-Beating Stocks. This is a curated list of our High Quality stocks that have generated a market-beating return of 175% over the last five years.
Stocks that made our list in 2019 include now familiar names such as Nvidia (+2,691% between September 2019 and September 2024) as well as under-the-radar businesses like United Rentals (+550% five-year return). Find your next big winner with StockStory today for free.