
Sinclair has followed the market’s trajectory closely, rising in tandem with the S&P 500 over the past six months. The stock has climbed by 10.6% to $13.01 per share while the index has gained 9.7%.
Is there a buying opportunity in Sinclair, or does it present a risk to your portfolio? See what our analysts have to say in our full research report, it’s free.We're swiping left on Sinclair for now. Here are three reasons why SBGI doesn't excite us and a stock we'd rather own.
Why Do We Think Sinclair Will Underperform?
Founded in 1971, Sinclair (NASDAQ: SBGI) is an American media company operating numerous television stations and providing multi-platform broadcasting services.
1. Long-Term Revenue Growth Flatter Than a Pancake
Reviewing a company’s long-term sales performance reveals insights into its quality. Any business can have short-term success, but a top-tier one grows for years. Unfortunately, Sinclair struggled to consistently increase demand as its $3.37 billion of sales for the trailing 12 months was close to its revenue five years ago. This was below our standards and signals it’s a low quality business. 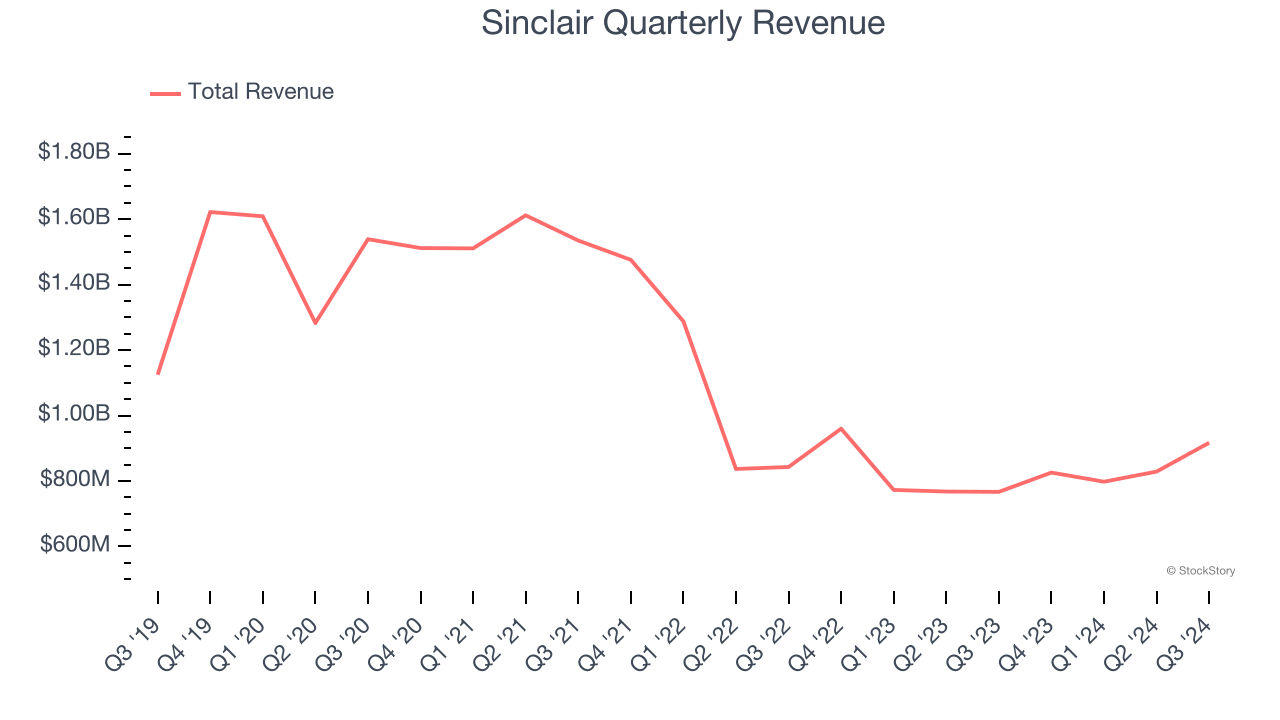
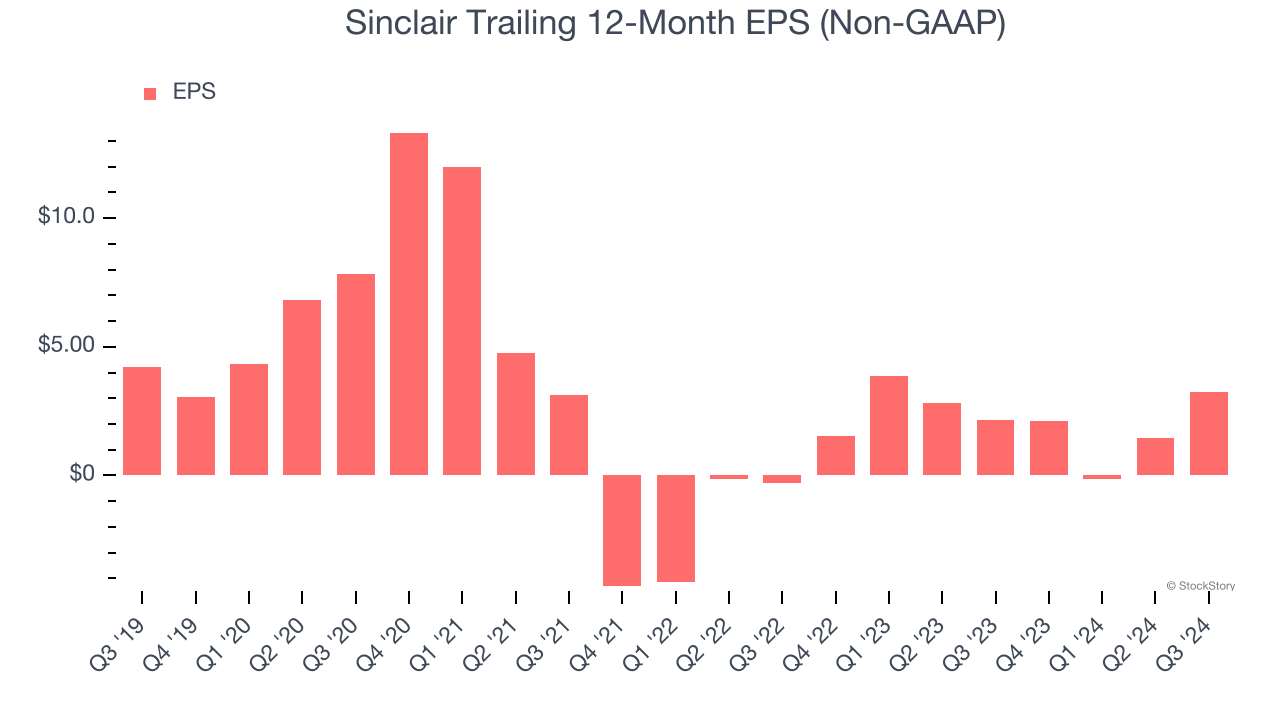
2. EPS Trending Down
Analyzing the long-term change in earnings per share (EPS) shows whether a company's incremental sales were profitable – for example, revenue could be inflated through excessive spending on advertising and promotions.
Sadly for Sinclair, its EPS declined by 5.1% annually over the last five years while its revenue was flat. This tells us the company struggled because its fixed cost base made it difficult to adjust to choppy demand.
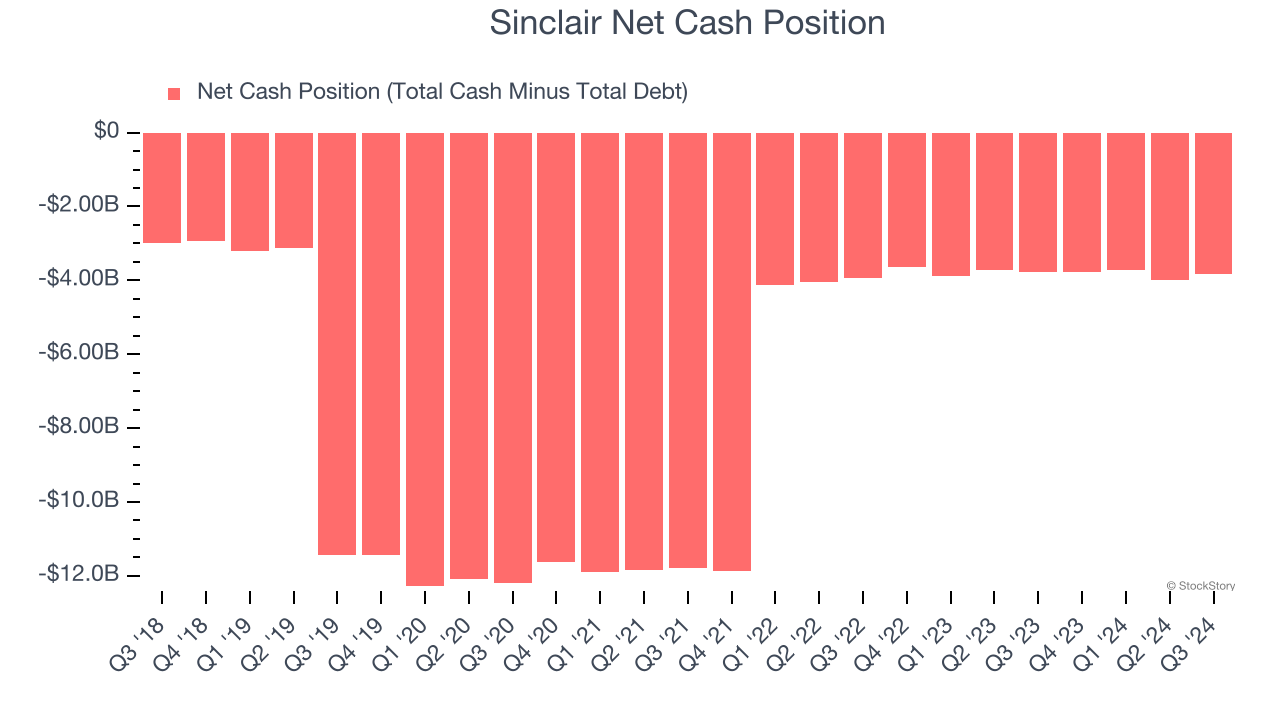
3. High Debt Levels Increase Risk
Debt is a tool that can boost company returns but presents risks if used irresponsibly. As long-term investors, we aim to avoid companies taking excessive advantage of this instrument because it could lead to insolvency.
Sinclair’s $4.37 billion of debt exceeds the $536 million of cash on its balance sheet. Furthermore, its 5× net-debt-to-EBITDA ratio (based on its EBITDA of $726 million over the last 12 months) shows the company is overleveraged.
At this level of debt, incremental borrowing becomes increasingly expensive and credit agencies could downgrade the company’s rating if profitability falls. Sinclair could also be backed into a corner if the market turns unexpectedly – a situation we seek to avoid as investors in high-quality companies.
We hope Sinclair can improve its balance sheet and remain cautious until it increases its profitability or pays down its debt.
Final Judgment
Sinclair doesn’t pass our quality test. That said, the stock currently trades at 7.2× forward price-to-earnings (or $13.01 per share). While this valuation is optically cheap, the potential downside is huge given its shaky fundamentals. There are better investments elsewhere. We’d recommend looking at Cloudflare, one of our top software picks that could be a home run with edge computing.
Stocks We Would Buy Instead of Sinclair
The elections are now behind us. With rates dropping and inflation cooling, many analysts expect a breakout market to cap off the year - and we’re zeroing in on the stocks that could benefit immensely.
Take advantage of the rebound by checking out our Top 5 Strong Momentum Stocks for this week. This is a curated list of our High Quality stocks that have generated a market-beating return of 175% over the last five years.
Stocks that made our list in 2019 include now familiar names such as Nvidia (+2,691% between September 2019 and September 2024) as well as under-the-radar businesses like Comfort Systems (+783% five-year return). Find your next big winner with StockStory today for free.


