Over the past six months, Oxford Industries’s shares (currently trading at $79.78) have posted a disappointing 19.9% loss, well below the S&P 500’s 9.9% gain. This was partly driven by its softer quarterly results and may have investors wondering how to approach the situation.
Is now the time to buy Oxford Industries, or should you be careful about including it in your portfolio? Get the full stock story straight from our expert analysts, it’s free.Even with the cheaper entry price, we're swiping left on Oxford Industries for now. Here are three reasons why we avoid OXM and a stock we'd rather own.
Why Do We Think Oxford Industries Will Underperform?
The parent company of Tommy Bahama, Oxford Industries (NYSE: OXM) is a lifestyle fashion conglomerate with brands that embody outdoor happiness.
1. Long-Term Revenue Growth Disappoints
A company’s long-term sales performance can indicate its overall quality. Any business can put up a good quarter or two, but many enduring ones grow for years. Regrettably, Oxford Industries’s sales grew at a sluggish 6.4% compounded annual growth rate over the last five years. This fell short of our benchmark for the consumer discretionary sector. 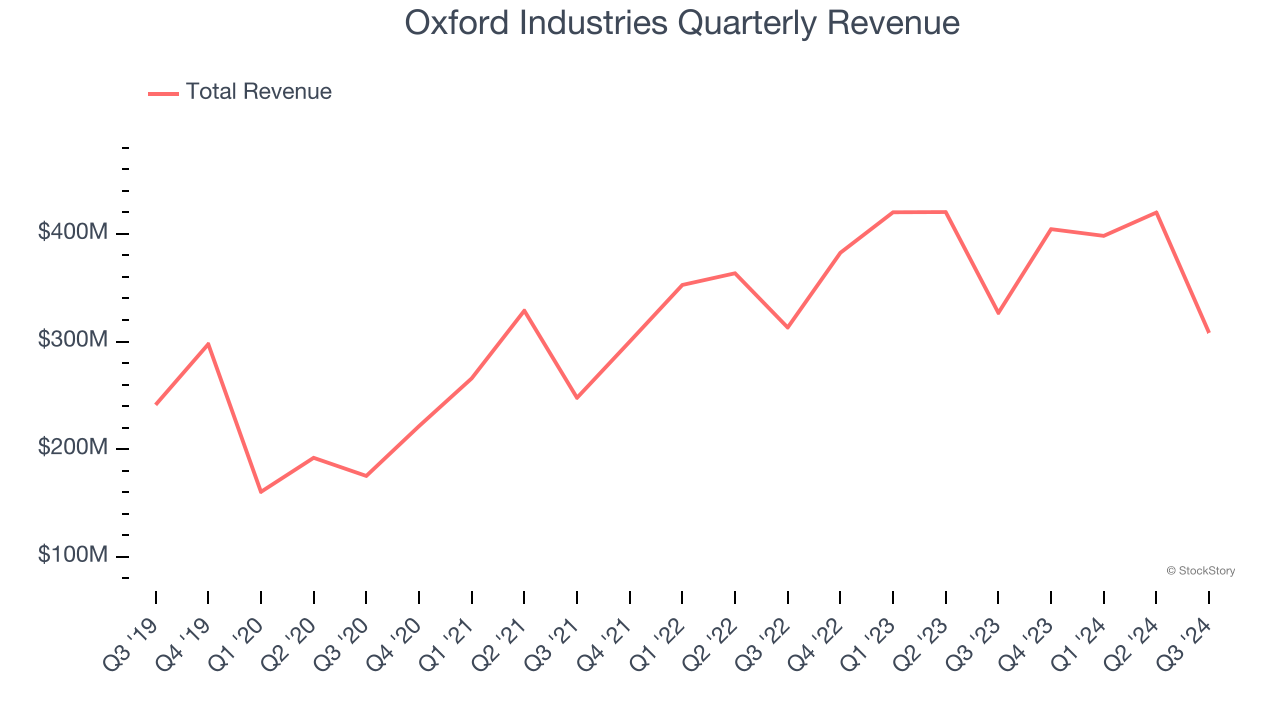
2. Same-Store Sales Falling Behind Peers
In addition to reported revenue, same-store sales are a useful data point for analyzing Apparel and Accessories companies. This metric measures the change in sales at brick-and-mortar locations that have existed for at least a year, giving visibility into Oxford Industries’s underlying demand characteristics.
Over the last two years, Oxford Industries’s same-store sales averaged 2% year-on-year growth. This performance was underwhelming and suggests it might have to change its strategy or pricing, which can disrupt operations. 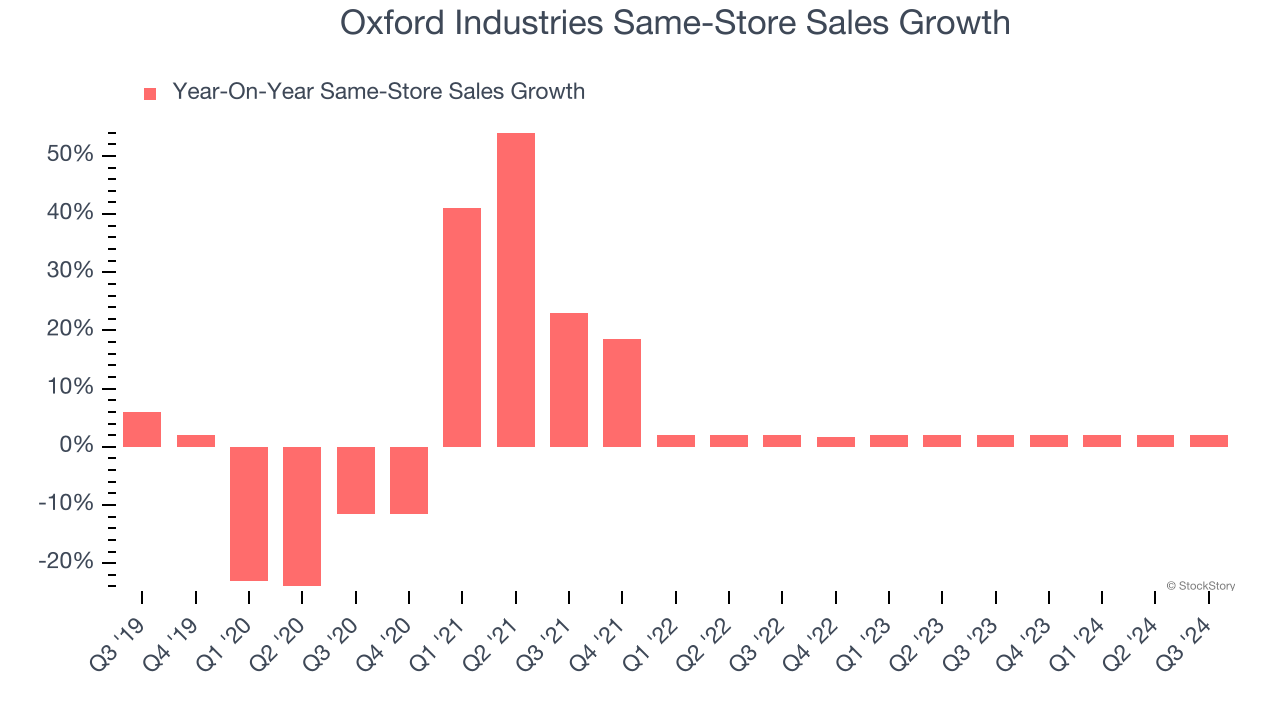
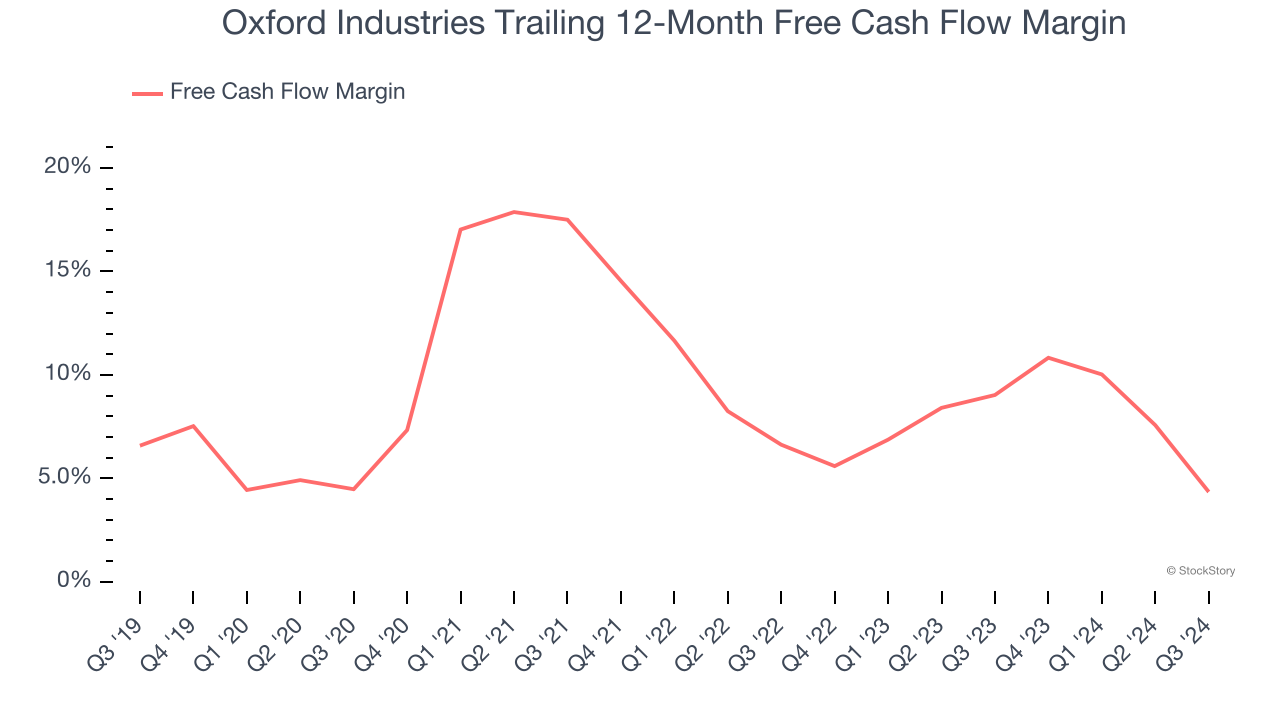
3. Mediocre Free Cash Flow Margin Limits Reinvestment Potential
If you’ve followed StockStory for a while, you know we emphasize free cash flow. Why, you ask? We believe that in the end, cash is king, and you can’t use accounting profits to pay the bills.
Oxford Industries has shown weak cash profitability over the last two years, giving the company limited opportunities to return capital to shareholders. Its free cash flow margin averaged 6.7%, subpar for a consumer discretionary business.
Final Judgment
We see the value of companies helping consumers, but in the case of Oxford Industries, we’re out. Following the recent decline, the stock trades at 10.5× forward price-to-earnings (or $79.78 per share). This valuation is reasonable, but the company’s shaky fundamentals present too much downside risk. There are superior stocks to buy right now. We’d recommend looking at Yum! Brands, an all-weather company that owns household favorite Taco Bell.
Stocks We Like More Than Oxford Industries
With rates dropping, inflation stabilizing, and the elections in the rearview mirror, all signs point to the start of a new bull run - and we’re laser-focused on finding the best stocks for this upcoming cycle.
Put yourself in the driver’s seat by checking out our Top 9 Market-Beating Stocks. This is a curated list of our High Quality stocks that have generated a market-beating return of 175% over the last five years.
Stocks that made our list in 2019 include now familiar names such as Nvidia (+2,691% between September 2019 and September 2024) as well as under-the-radar businesses like United Rentals (+550% five-year return). Find your next big winner with StockStory today for free.