Over the past six months, Rollins’s shares (currently trading at $46.60) have posted a disappointing 5.7% loss, well below the S&P 500’s 10% gain. This was partly due to its softer quarterly results and might have investors contemplating their next move.
Following the pullback, is this a buying opportunity for ROL? Find out in our full research report, it’s free.
Why Is Rollins a Good Business?
Operating under multiple brands like Orkin and HomeTeam Pest Defense, Rollins (NYSE: ROL) provides pest and wildlife control services to residential and commercial customers.
1. Core Business Firing on All Cylinders
We can better understand Facility Services companies by analyzing their organic revenue. This metric gives visibility into Rollins’s core business because it excludes one-time events such as mergers, acquisitions, and divestitures along with foreign currency fluctuations - non-fundamental factors that can manipulate the income statement.
Over the last two years, Rollins’s organic revenue averaged 75,425,825,000% year-on-year growth. This performance was fantastic and shows it can expand quickly without relying on expensive (and risky) acquisitions.
2. Elite Gross Margin Powers Best-In-Class Business Model
All else equal, we prefer higher gross margins because they make it easier to generate more operating profits and indicate that a company commands pricing power by offering more differentiated products.
Rollins has best-in-class unit economics for an industrials company, enabling it to invest in areas such as research and development. Its margin also signals it sells differentiated products, not commodities. As you can see below, it averaged an elite 52% gross margin over the last five years. Said differently, roughly $51.99 was left to spend on selling, marketing, R&D, and general administrative overhead for every $100 in revenue. 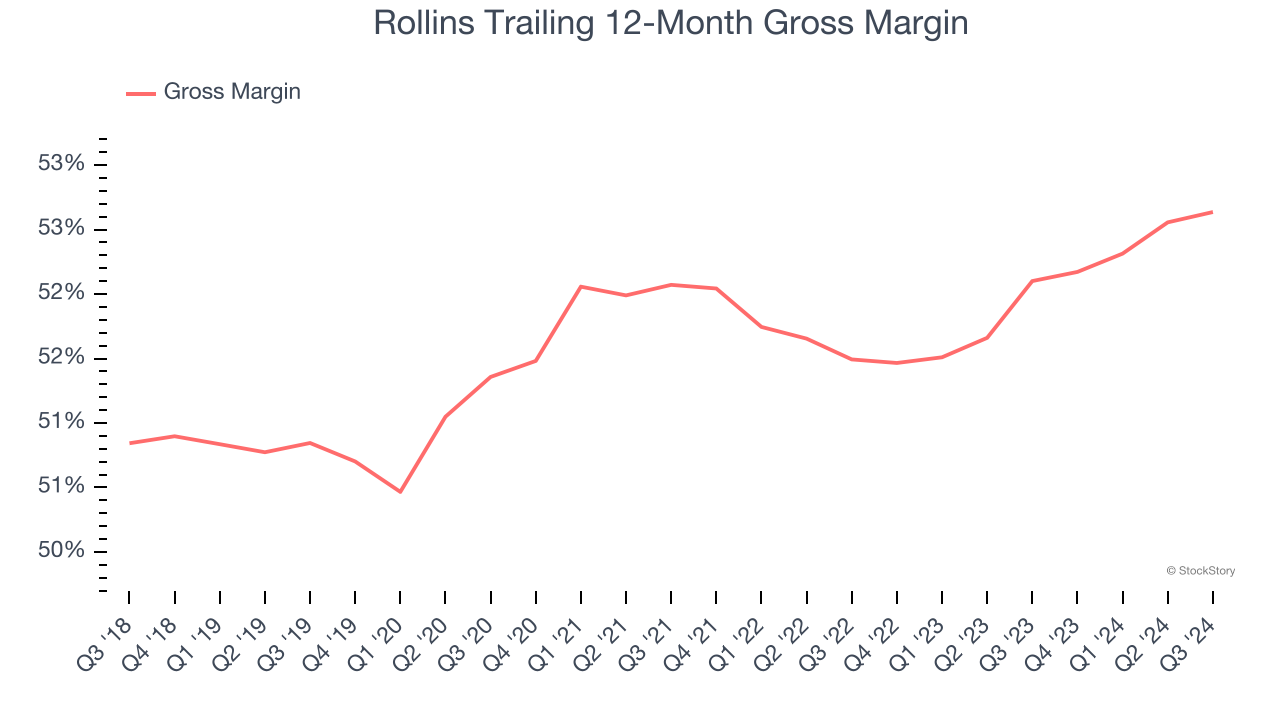
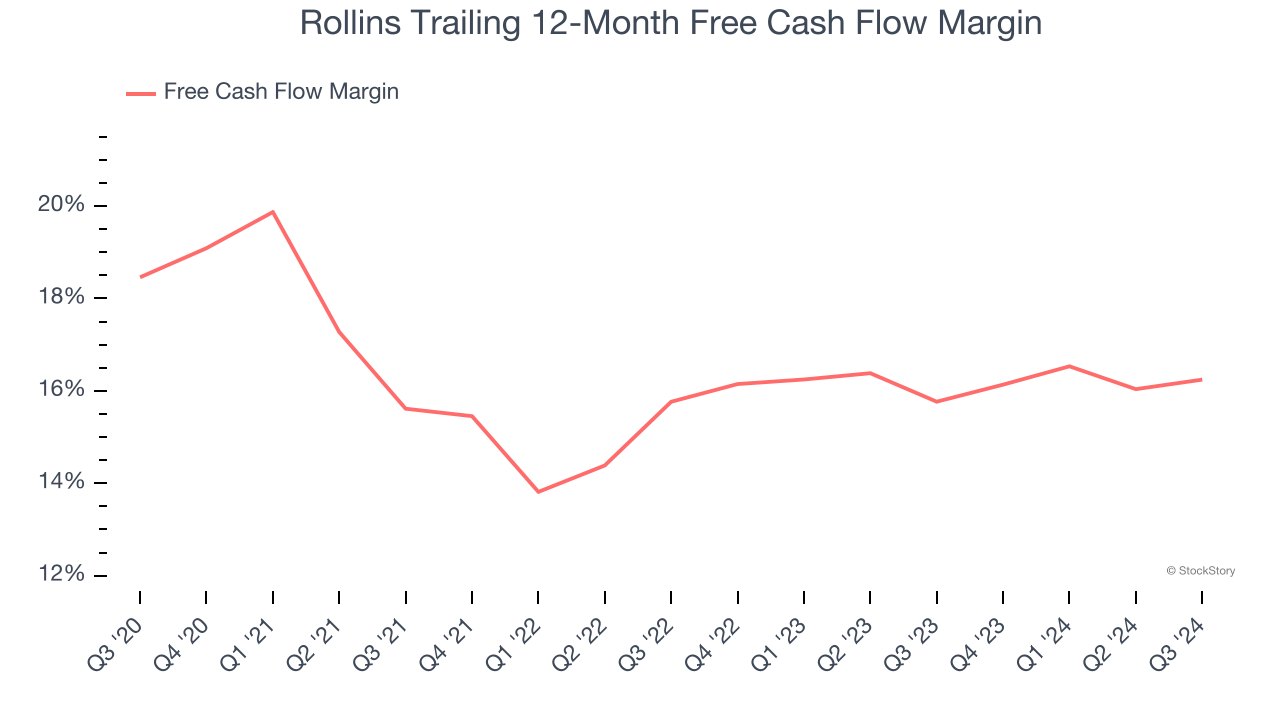
3. Excellent Free Cash Flow Margin Boosts Reinvestment Potential
If you’ve followed StockStory for a while, you know we emphasize free cash flow. Why, you ask? We believe that in the end, cash is king, and you can’t use accounting profits to pay the bills.
Rollins has shown terrific cash profitability, putting it in an advantageous position to invest in new products, return capital to investors, and consolidate the market during industry downturns. The company’s free cash flow margin was among the best in the industrials sector, averaging 16.3% over the last five years.
Final Judgment
These are just a few reasons why we're bullish on Rollins. With the recent decline, the stock trades at 42.5× forward price-to-earnings (or $46.60 per share). Is now a good time to initiate a position? See for yourself in our full research report, it’s free.
Stocks We Like Even More Than Rollins
The Trump trade may have passed, but rates are still dropping and inflation is still cooling. Opportunities are ripe for those ready to act - and we’re here to help you pick them.
Get started by checking out our Top 5 Strong Momentum Stocks for this week. This is a curated list of our High Quality stocks that have generated a market-beating return of 175% over the last five years.
Stocks that made our list in 2019 include now familiar names such as Nvidia (+2,691% between September 2019 and September 2024) as well as under-the-radar businesses like United Rentals (+550% five-year return). Find your next big winner with StockStory today for free.