EV charging solutions provider ChargePoint Holdings (NYSE: CHPT) reported revenue ahead of Wall Street’s expectations in Q3 CY2024, but sales fell by 9.7% year on year to $99.61 million. On the other hand, next quarter’s revenue guidance of $100 million was less impressive, coming in 1% below analysts’ estimates. Its GAAP loss of $0.18 per share was in line with analysts’ consensus estimates.
Is now the time to buy ChargePoint? Find out by accessing our full research report, it’s free.
ChargePoint (CHPT) Q3 CY2024 Highlights:
- Revenue: $99.61 million vs analyst estimates of $89.58 million (9.7% year-on-year decline, 11.2% beat)
- Adjusted EPS: -$0.18 vs analyst estimates of -$0.17 (in line)
- Adjusted EBITDA: -$28.59 million vs analyst estimates of -$33.27 million (-28.7% margin, 14.1% beat)
- Revenue Guidance for Q4 CY2024 is $100 million at the midpoint, below analyst estimates of $101 million
- Operating Margin: -68.4%, up from -139% in the same quarter last year
- Free Cash Flow was -$33.39 million compared to -$101.7 million in the same quarter last year
- Market Capitalization: $500.6 million
“We are encouraged by record EV sales in the industry, and we continue to see network utilization driving the need for more charging infrastructure,” said Rick Wilmer, CEO of ChargePoint.
Company Overview
The most prominent EV charging company during the COVID bull market, ChargePoint (NYSE: CHPT) is a provider of electric vehicle charging technology solutions in North America and Europe.
Renewable Energy
Renewable energy companies are buoyed by the secular trend of green energy that is upending traditional power generation. Those who innovate and evolve with this dynamic market can win share while those who continue to rely on legacy technologies can see diminishing demand, which includes headwinds from increasing regulation against “dirty” energy. Additionally, these companies are at the whim of economic cycles, as interest rates can impact the willingness to invest in renewable energy projects.
Sales Growth
A company’s long-term performance is an indicator of its overall quality. While any business can experience short-term success, top-performing ones enjoy sustained growth for years. Over the last five years, ChargePoint grew its sales at an incredible 19% compounded annual growth rate. Its growth beat the average industrials company and shows its offerings resonate with customers.
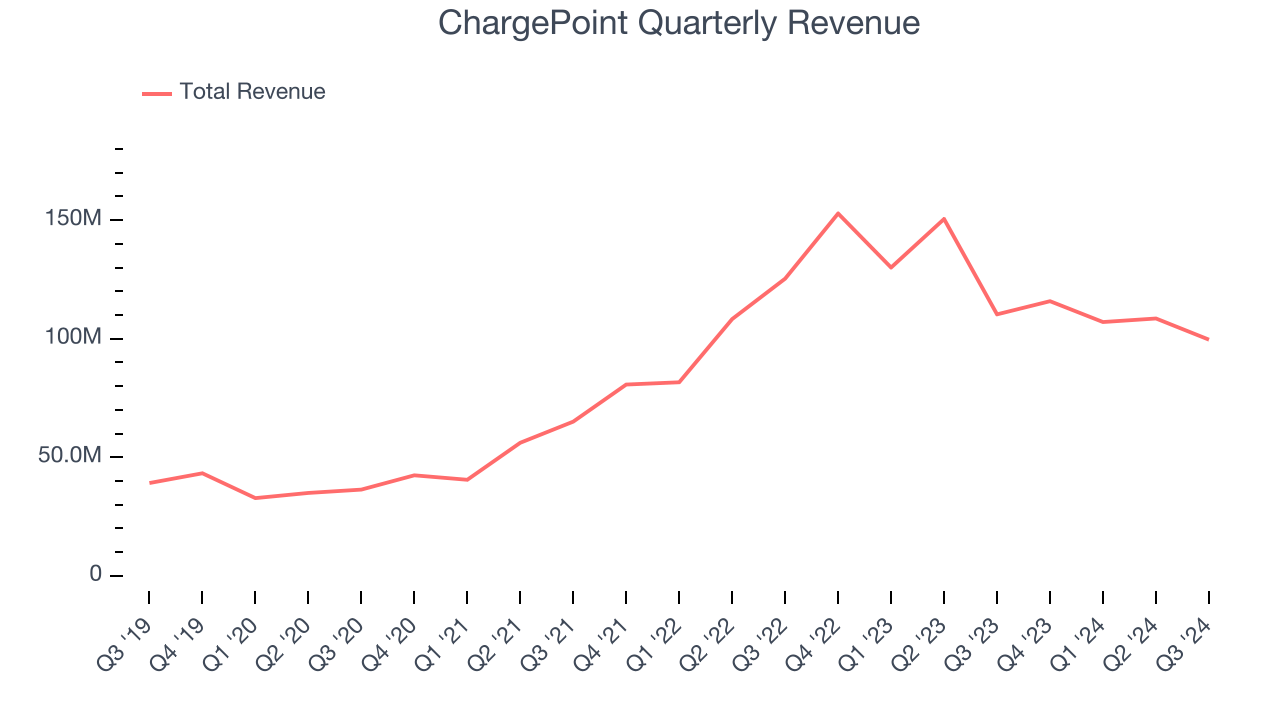
We at StockStory place the most emphasis on long-term growth, but within industrials, a half-decade historical view may miss cycles, industry trends, or a company capitalizing on catalysts such as a new contract win or a successful product line. ChargePoint’s recent history shows its demand slowed significantly as its annualized revenue growth of 4.3% over the last two years is well below its five-year trend. 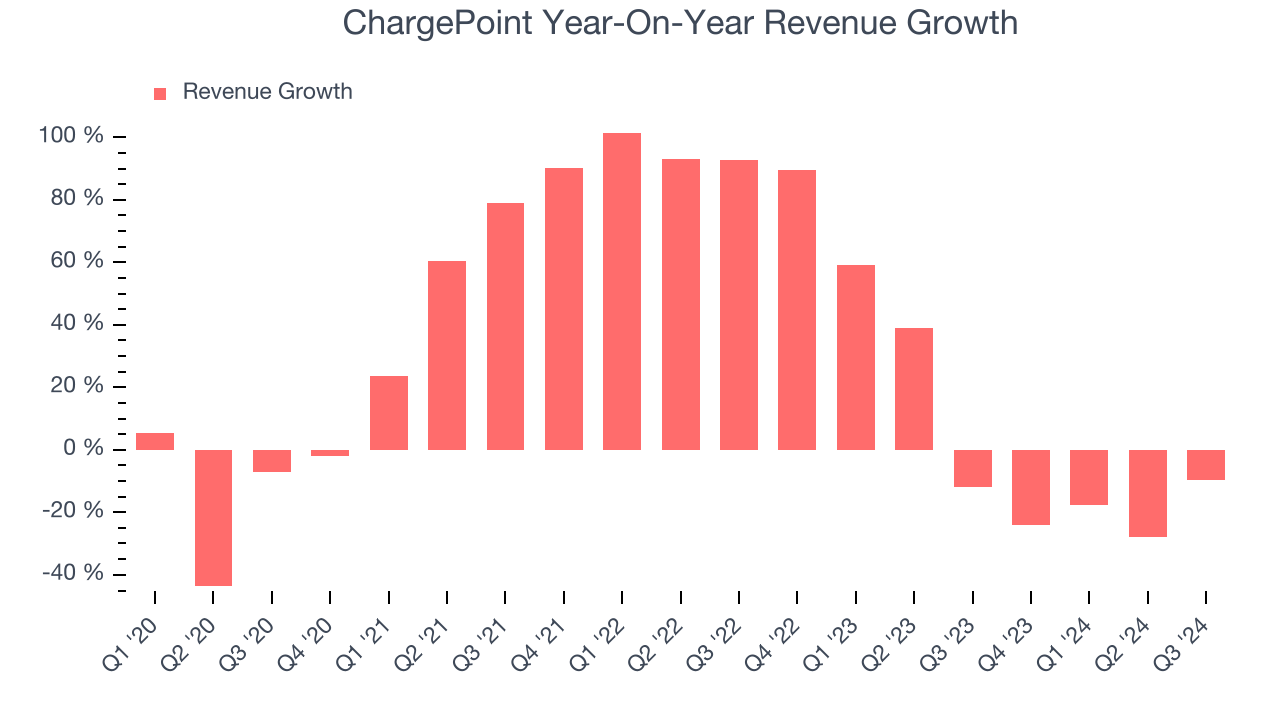
ChargePoint also breaks out the revenue for its most important segments, Networked Charging Systems and Subscriptions, which are 52.9% and 36.6% of revenue. Over the last two years, ChargePoint’s Networked Charging Systems revenue (hardware) averaged 4.8% year-on-year growth while its Subscriptions revenue (software) averaged 35.6% growth.
This quarter, ChargePoint’s revenue fell by 9.7% year on year to $99.61 million but beat Wall Street’s estimates by 11.2%. Company management is currently guiding for a 13.7% year-on-year decline in sales next quarter.
Looking further ahead, sell-side analysts expect revenue to grow 8.2% over the next 12 months, an improvement versus the last two years. This projection is above the sector average and suggests its newer products and services will catalyze better top-line performance.
Today’s young investors won’t have read the timeless lessons in Gorilla Game: Picking Winners In High Technology because it was written more than 20 years ago when Microsoft and Apple were first establishing their supremacy. But if we apply the same principles, then enterprise software stocks leveraging their own generative AI capabilities may well be the Gorillas of the future. So, in that spirit, we are excited to present our Special Free Report on a profitable, fast-growing enterprise software stock that is already riding the automation wave and looking to catch the generative AI next.
Operating Margin
Operating margin is one of the best measures of profitability because it tells us how much money a company takes home after procuring and manufacturing its products, marketing and selling those products, and most importantly, keeping them relevant through research and development.
ChargePoint’s high expenses have contributed to an average operating margin of negative 81.9% over the last five years. Unprofitable industrials companies require extra attention because they could get caught swimming naked when the tide goes out. It’s hard to trust that the business can endure a full cycle.
On the plus side, ChargePoint’s operating margin rose by 12.7 percentage points over the last five years, as its sales growth gave it operating leverage. Still, it will take much more for the company to reach long-term profitability.
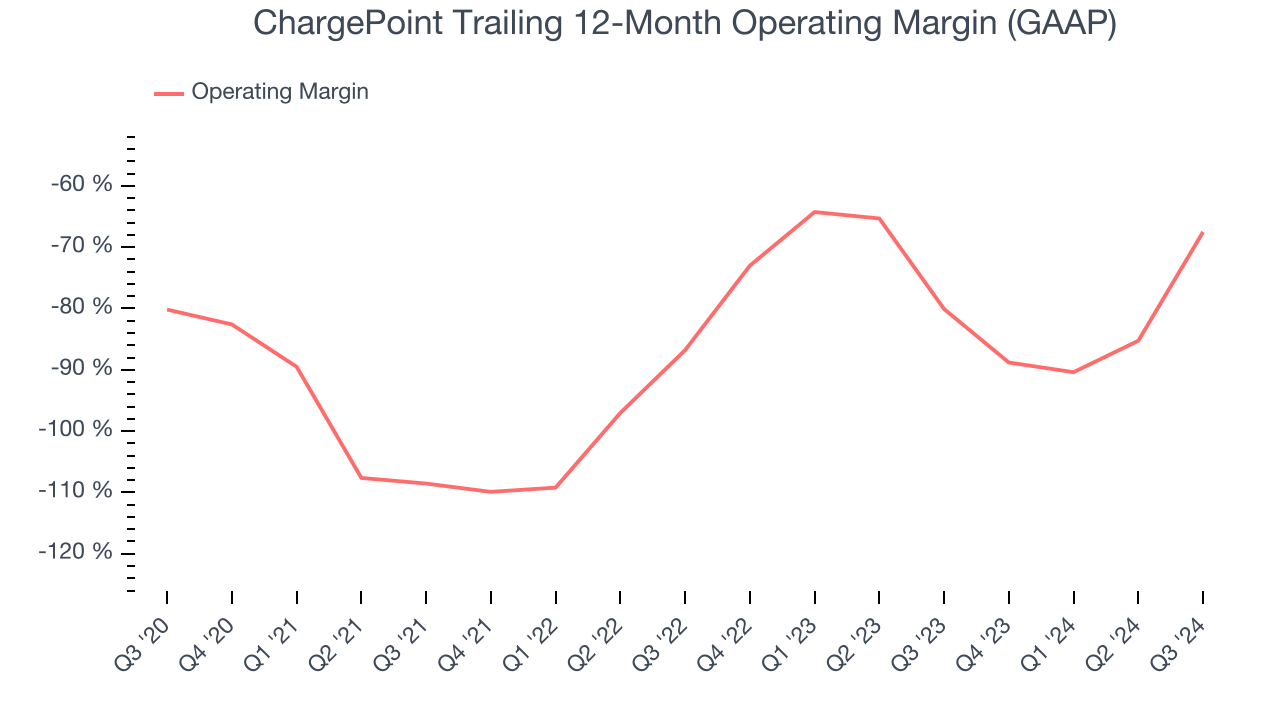
In Q3, ChargePoint generated a negative 68.4% operating margin. The company's consistent lack of profits raise a flag.
Earnings Per Share
We track the long-term change in earnings per share (EPS) for the same reason as long-term revenue growth. Compared to revenue, however, EPS highlights whether a company’s growth is profitable.
Although ChargePoint’s full-year earnings are still negative, it reduced its losses and improved its EPS by 50.5% annually over the last five years. The next few quarters will be critical for assessing its long-term profitability. We hope to see an inflection point soon.
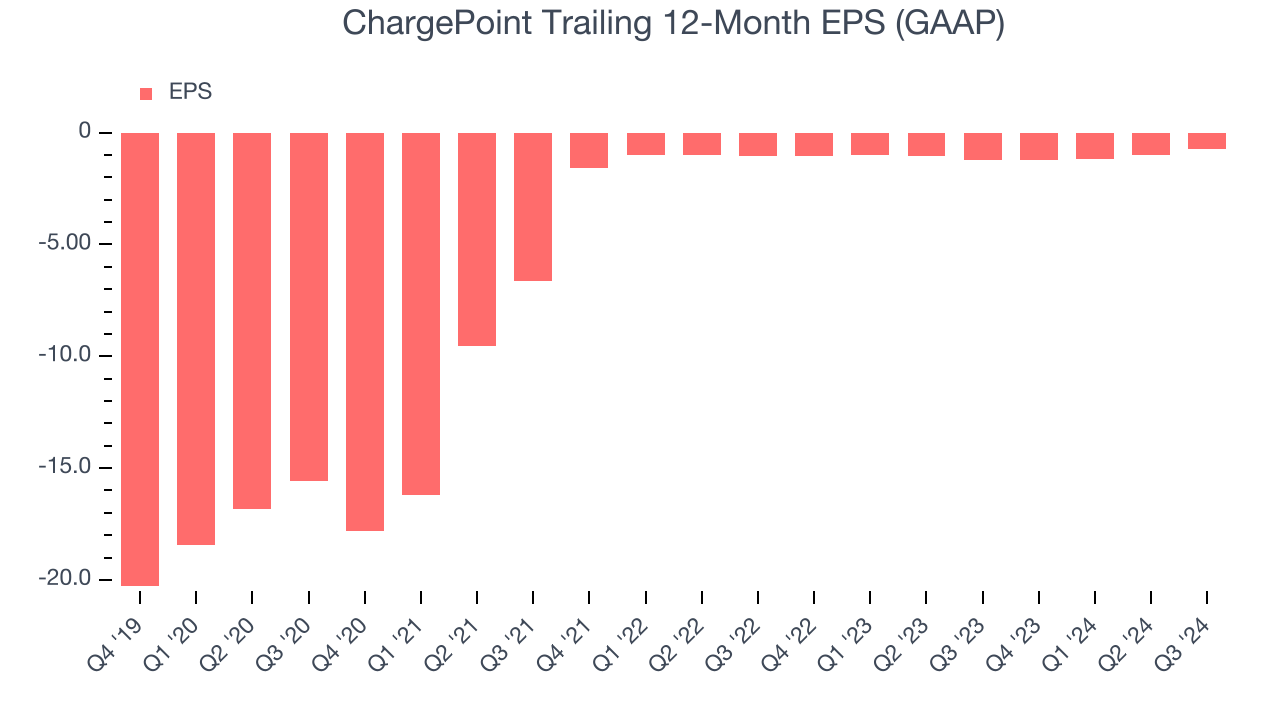
Like with revenue, we analyze EPS over a shorter period to see if we are missing a change in the business.
For ChargePoint, its two-year annual EPS growth of 15.2% was lower than its five-year trend. We still think its growth was good and hope it can accelerate in the future.In Q3, ChargePoint reported EPS at negative $0.18, up from negative $0.42 in the same quarter last year. Despite growing year on year, this print missed analysts’ estimates. Over the next 12 months, Wall Street is optimistic. Analysts forecast ChargePoint’s full-year EPS of negative $0.74 will reach break even.
Key Takeaways from ChargePoint’s Q3 Results
We were impressed by how significantly ChargePoint blew past analysts’ EBITDA expectations this quarter. We were also excited its revenue outperformed Wall Street’s estimates by a wide margin. On the other hand, its revenue guidance for next quarter fell slightly short of Wall Street’s estimates, but the shortfall was quite small. Overall, this quarter had more good than bad, and as a result, the stock traded up 13.5% to $1.39 immediately after reporting.
Sure, ChargePoint had a solid quarter, but if we look at the bigger picture, is this stock a buy? If you’re making that decision, you should consider the bigger picture of valuation, business qualities, as well as the latest earnings. We cover that in our actionable full research report which you can read here, it’s free.