
Rockwell Automation trades at $295.53 and has moved in lockstep with the market. Its shares have returned 15.8% over the last six months while the S&P 500 has gained 13.5%.
Is now the time to buy Rockwell Automation, or should you be careful about including it in your portfolio? Check out our in-depth research report to see what our analysts have to say, it’s free.We're sitting this one out for now. Here are three reasons why ROK doesn't excite us and a stock we'd rather own.
Why Do We Think Rockwell Automation Will Underperform?
One of the first companies to address industrial automation, Rockwell Automation (NYSE: ROK) sells products that help customers extract more efficiency from their machinery.
1. Slow Organic Growth Suggests Waning Demand In Core Business
Investors interested in Internet of Things companies should track organic revenue in addition to reported revenue. This metric gives visibility into Rockwell Automation’s core business because it excludes one-time events such as mergers, acquisitions, and divestitures along with foreign currency fluctuations - non-fundamental factors that can manipulate the income statement.
Over the last two years, Rockwell Automation’s organic revenue averaged 3.9% year-on-year growth. This performance was underwhelming and suggests it may need to improve its products, pricing, or go-to-market strategy, which can add an extra layer of complexity to its operations. 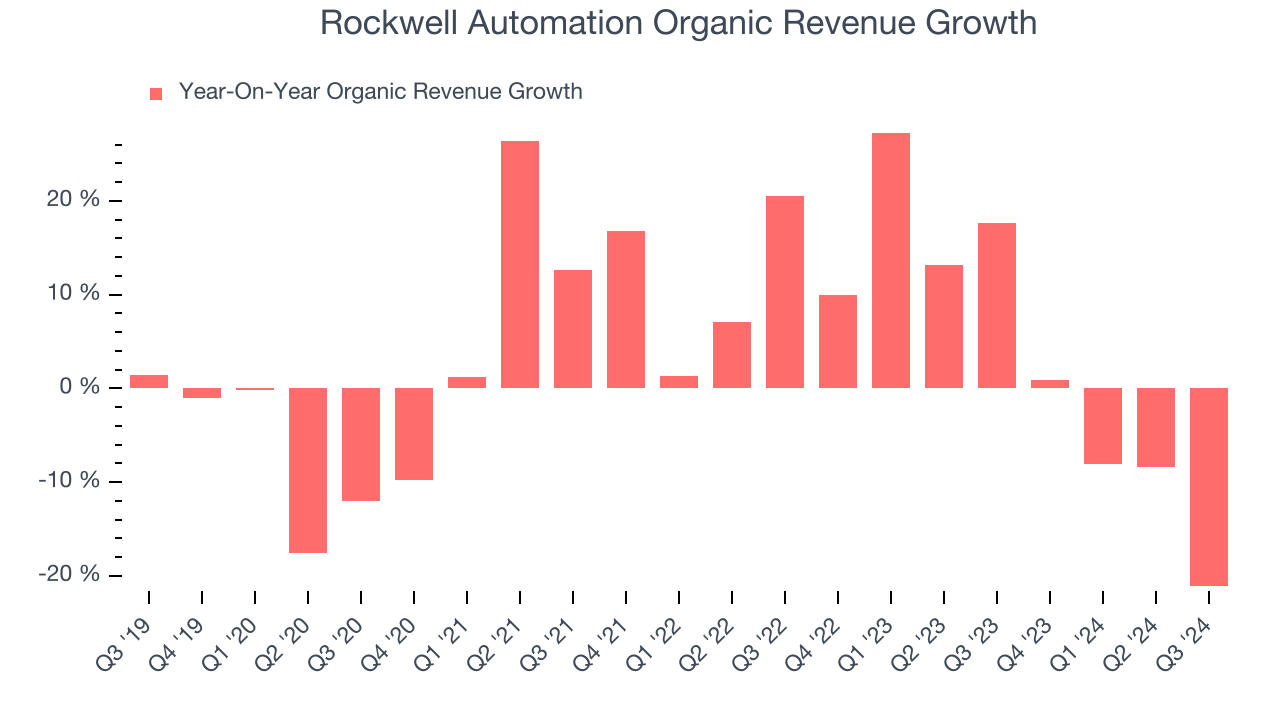
2. Free Cash Flow Margin Dropping
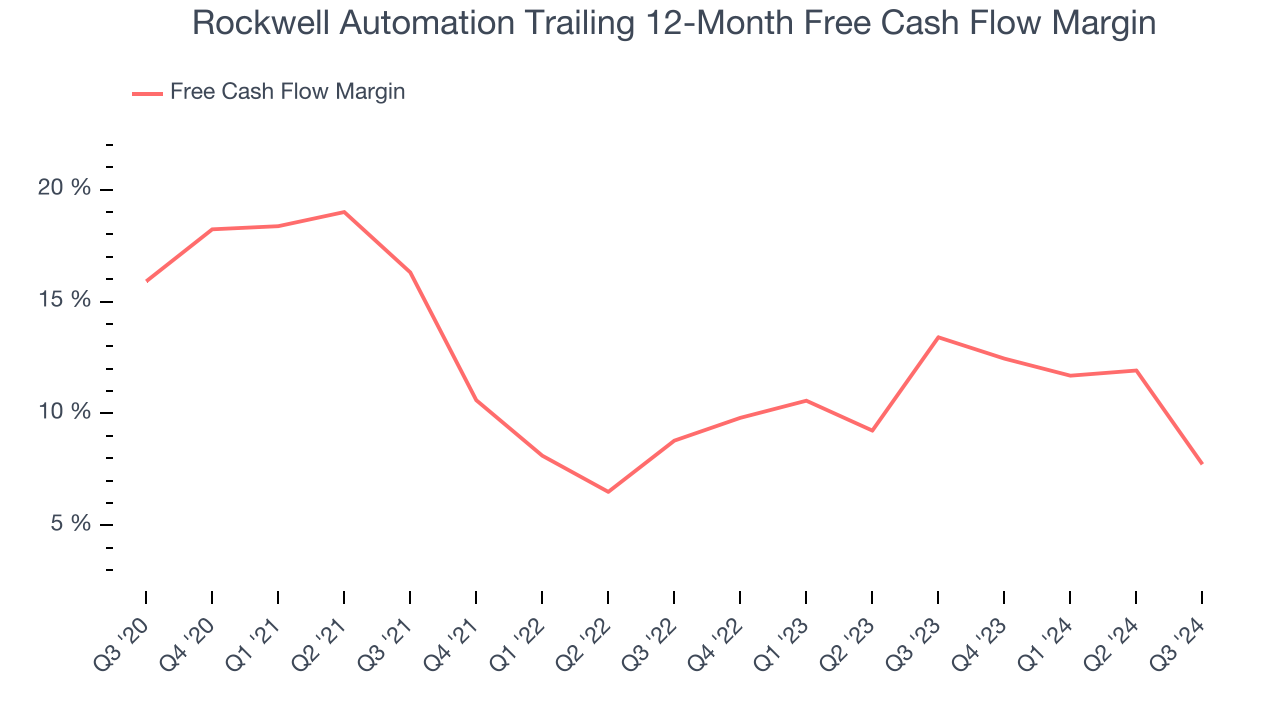
If you’ve followed StockStory for a while, you know we emphasize free cash flow. Why, you ask? We believe that in the end, cash is king, and you can’t use accounting profits to pay the bills.
As you can see below, Rockwell Automation’s margin dropped by 8.2 percentage points over the last five years. If its declines continue, it could signal higher capital intensity. Rockwell Automation’s free cash flow margin for the trailing 12 months was 7.7%.
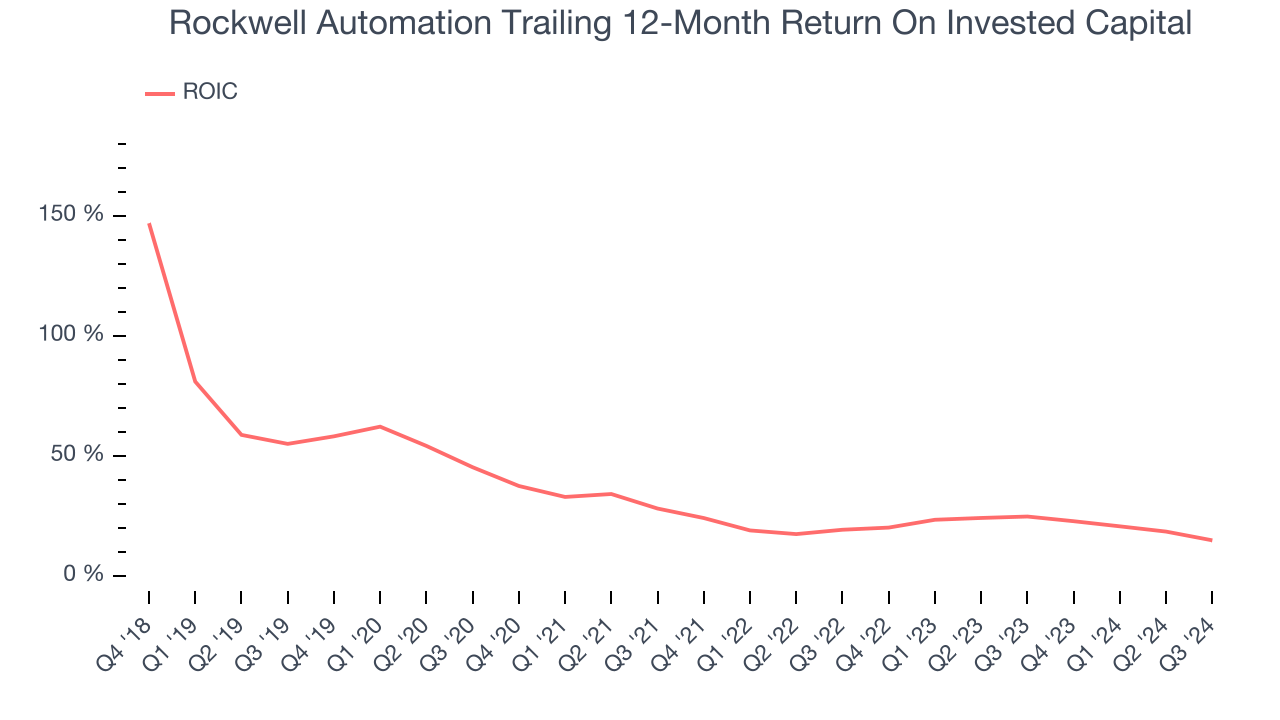
3. New Investments Fail to Bear Fruit as ROIC Declines
A company’s ROIC, or return on invested capital, shows how much operating profit it makes compared to the money it has raised (debt and equity).
We typically prefer to invest in companies with high returns because it means they have viable business models, but the trend in a company’s ROIC is often what surprises the market and moves the stock price. Over the last few years, Rockwell Automation’s ROIC has decreased significantly. We like what management has done in the past, but its declining returns are perhaps a symptom of fewer profitable growth opportunities.
Final Judgment
Rockwell Automation doesn’t pass our quality test. That said, the stock currently trades at 28.2× forward price-to-earnings (or $295.53 per share). This valuation tells us a lot of optimism is priced in - we think there are better investment opportunities out there. Let us point you toward Chipotle, which surprisingly still has a long runway for growth.
Stocks We Would Buy Instead of Rockwell Automation
The elections are now behind us. With rates dropping and inflation cooling, many analysts expect a breakout market to cap off the year - and we’re zeroing in on the stocks that could benefit immensely.
Take advantage of the rebound by checking out our Top 5 Strong Momentum Stocks for this week. This is a curated list of our High Quality stocks that have generated a market-beating return of 175% over the last five years.
Stocks that made our list in 2019 include now familiar names such as Nvidia (+2,691% between September 2019 and September 2024) as well as under-the-radar businesses like United Rentals (+550% five-year return). Find your next big winner with StockStory today for free.


