
Over the last six months, Impinj’s shares have sunk to $151.29, producing a disappointing 14.1% loss - a stark contrast to the S&P 500’s 4.2% gain. This may have investors wondering how to approach the situation.
Following the drawdown, is now the time to buy PI? Find out in our full research report, it’s free.
Why Is Impinj a Good Business?
Founded by Caltech professor Carver Mead and one of his students Chris Diorio, Impinj (NASDAQ: PI) is a maker of radio-frequency identification (RFID) hardware and software.
1. Skyrocketing Revenue Shows Strong Momentum
A company’s long-term sales performance can indicate its overall quality. Any business can put up a good quarter or two, but many enduring ones grow for years. Thankfully, Impinj’s 18.7% annualized revenue growth over the last five years was exceptional. Its growth surpassed the average semiconductor company and shows its offerings resonate with customers. Semiconductors are a cyclical industry, and long-term investors should be prepared for periods of high growth followed by periods of revenue contractions (which can sometimes offer opportune times to buy).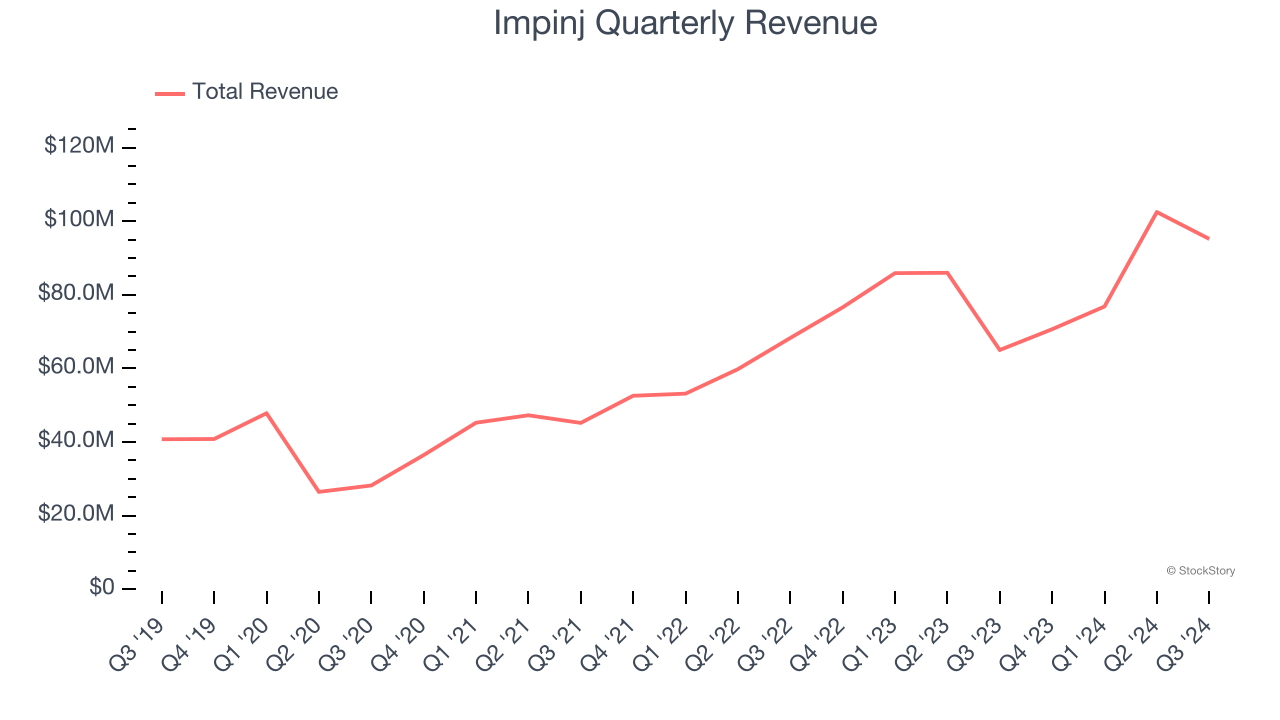
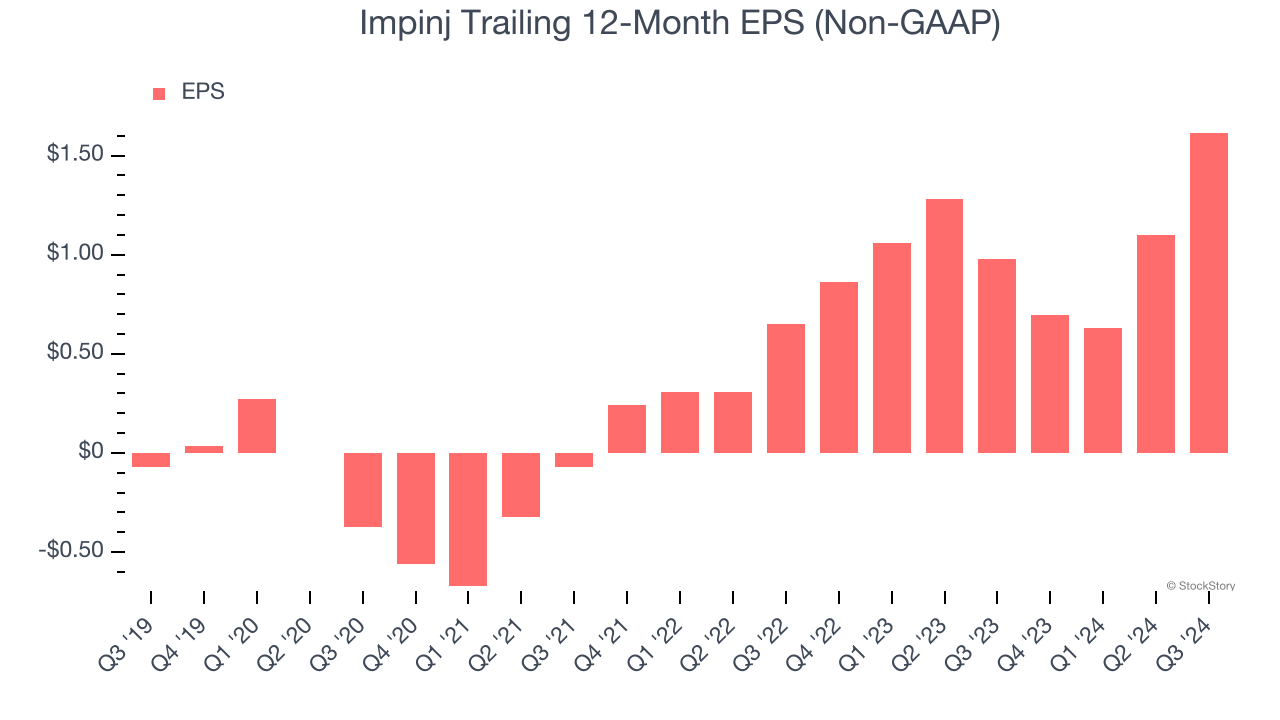
2. Outstanding Long-Term EPS Growth
Analyzing the long-term change in earnings per share (EPS) shows whether a company's incremental sales were profitable – for example, revenue could be inflated through excessive spending on advertising and promotions.
Impinj’s full-year EPS flipped from negative to positive over the last five years. This is a good sign and shows it’s at an inflection point.
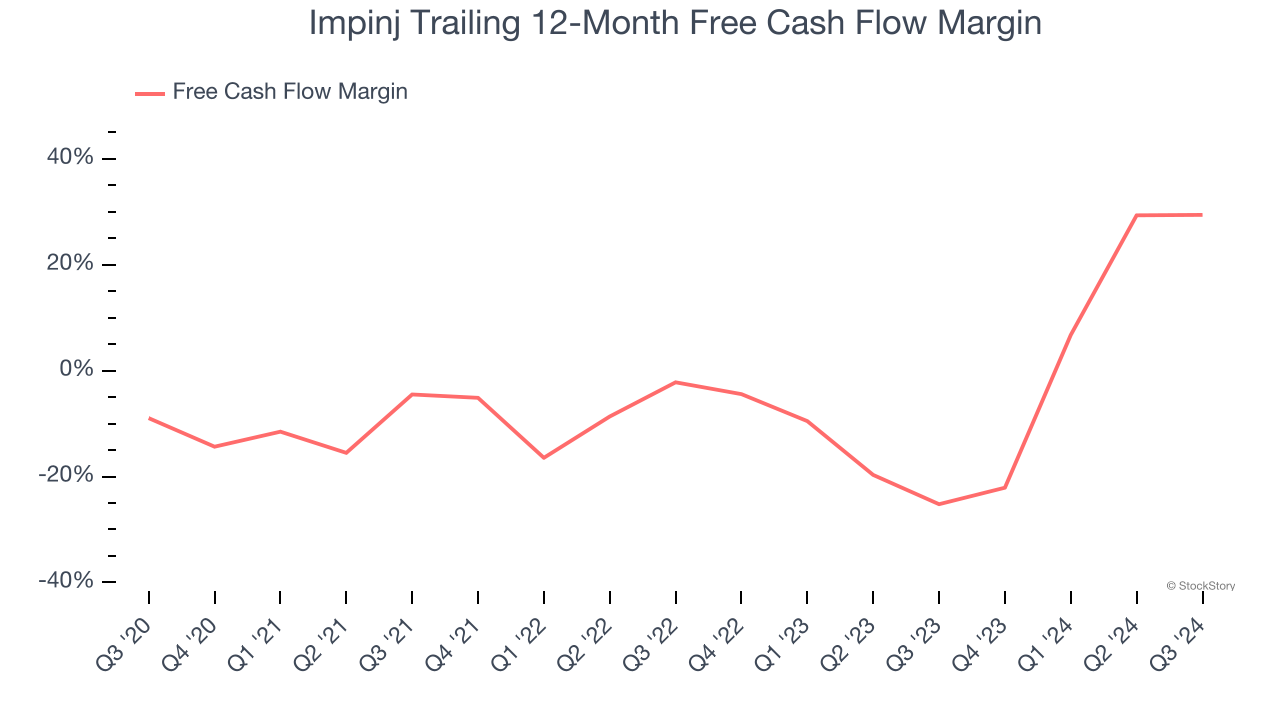
3. Increasing Free Cash Flow Margin Juices Financials
Free cash flow isn't a prominently featured metric in company financials and earnings releases, but we think it's telling because it accounts for all operating and capital expenses, making it tough to manipulate. Cash is king.
As you can see below, Impinj’s margin expanded by 38.4 percentage points over the last five years. The company’s improvement shows it’s heading in the right direction, and we can see it became a less capital-intensive business because its free cash flow profitability rose by more than its operating profitability. Impinj’s free cash flow margin for the trailing 12 months was 29.4%.
Final Judgment
These are just a few reasons why Impinj ranks highly on our list. With the recent decline, the stock trades at 58.2× forward price-to-earnings (or $151.29 per share). Is now a good time to initiate a position? See for yourself in our comprehensive research report, it’s free.
Stocks We Like Even More Than Impinj
The Trump trade may have passed, but rates are still dropping and inflation is still cooling. Opportunities are ripe for those ready to act - and we’re here to help you pick them.
Get started by checking out our Top 9 Market-Beating Stocks. This is a curated list of our High Quality stocks that have generated a market-beating return of 175% over the last five years.
Stocks that made our list in 2019 include now familiar names such as Nvidia (+2,691% between September 2019 and September 2024) as well as under-the-radar businesses like United Rentals (+550% five-year return). Find your next big winner with StockStory today for free.


