
Since July 2024, Stitch Fix has been in a holding pattern, posting a small return of 2.2% while floating around $5.11. This is close to the S&P 500’s 5.2% gain during that period.
Is there a buying opportunity in Stitch Fix, or does it present a risk to your portfolio? Get the full breakdown from our expert analysts, it’s free.
We're sitting this one out for now. Here are three reasons why SFIX doesn't excite us and a stock we'd rather own.
Why Do We Think Stitch Fix Will Underperform?
One of the original subscription box companies, Stitch Fix (NASDAQ: SFIX) is an online personal styling and fashion service that curates personalized clothing selections for customers.
1. Decline in Active Clients Points to Weak Demand
Revenue growth can be broken down into changes in price and volume (for companies like Stitch Fix, our preferred volume metric is active clients). While both are important, the latter is the most critical to analyze because prices have a ceiling.
Stitch Fix’s active clients came in at 2.43 million in the latest quarter, and over the last two years, averaged 17.4% year-on-year declines. This performance was underwhelming and implies there may be increasing competition or market saturation. It also suggests Stitch Fix might have to lower prices or invest in product improvements to grow, factors that can hinder near-term profitability. 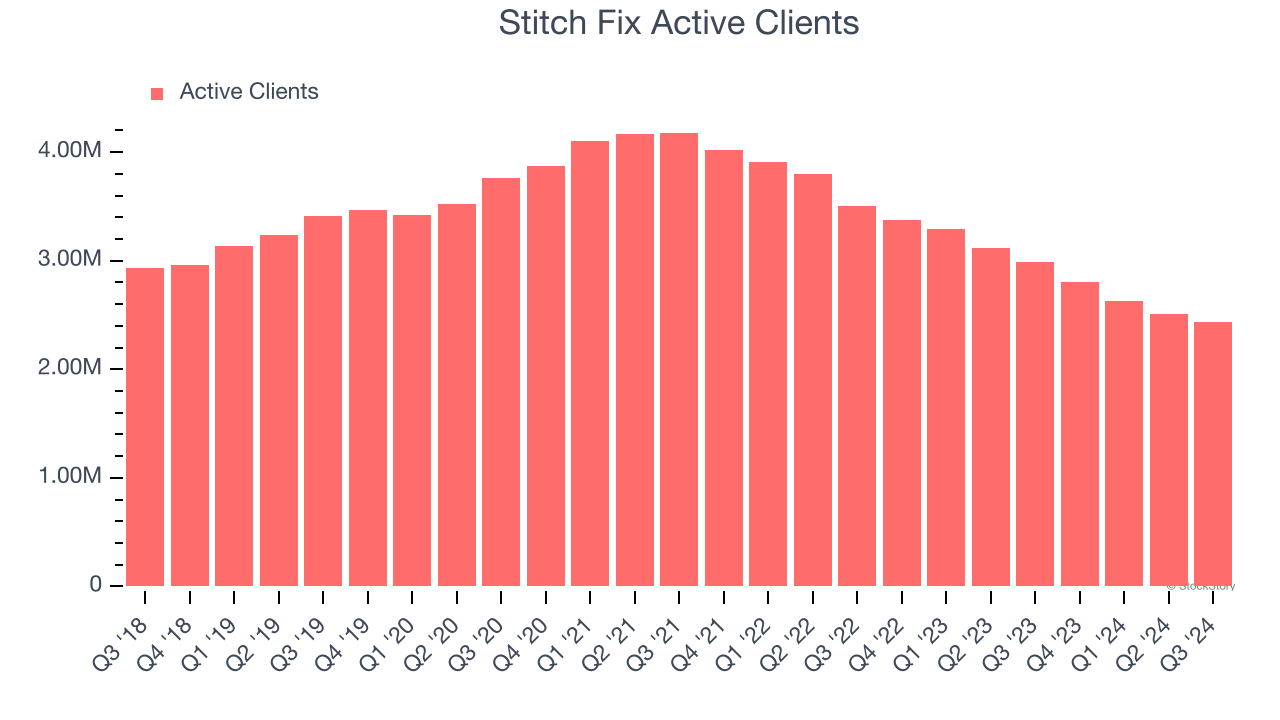
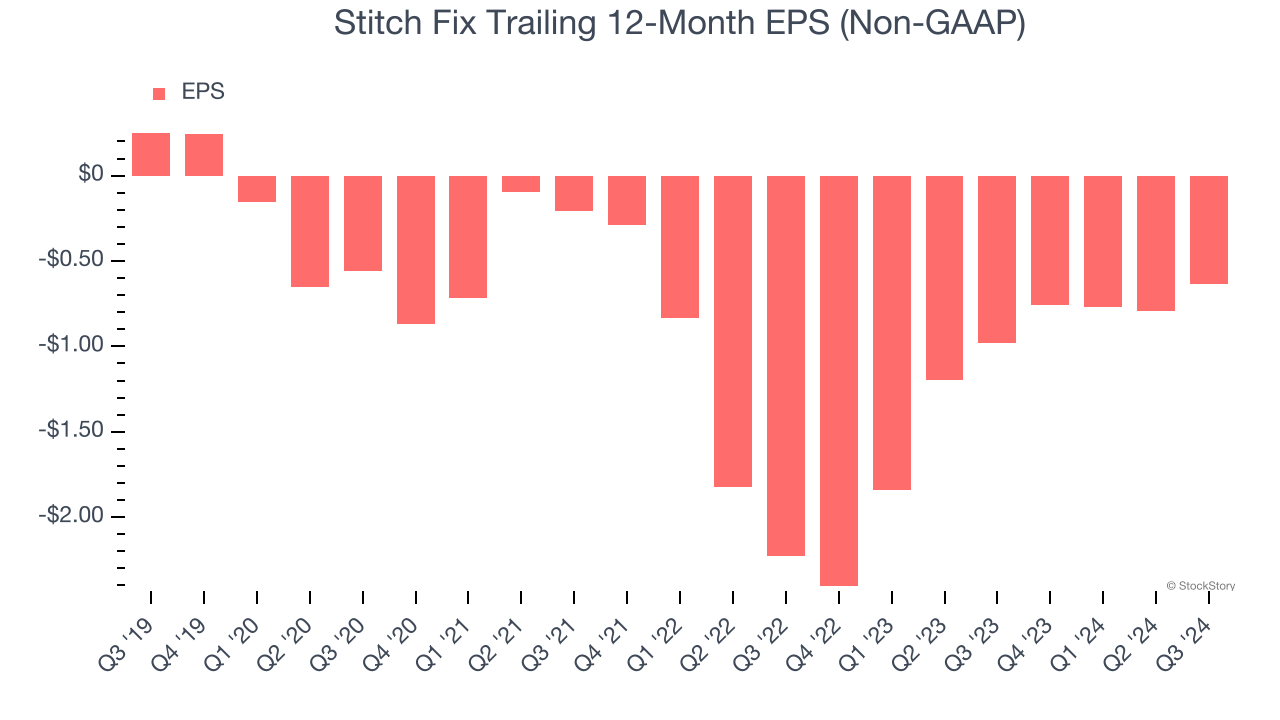
2. EPS Trending Down
Analyzing the long-term change in earnings per share (EPS) shows whether a company's incremental sales were profitable – for example, revenue could be inflated through excessive spending on advertising and promotions.
Sadly for Stitch Fix, its EPS declined by more than its revenue over the last five years, dropping 35.2% annually. This tells us the company struggled because its fixed cost base made it difficult to adjust to shrinking demand.
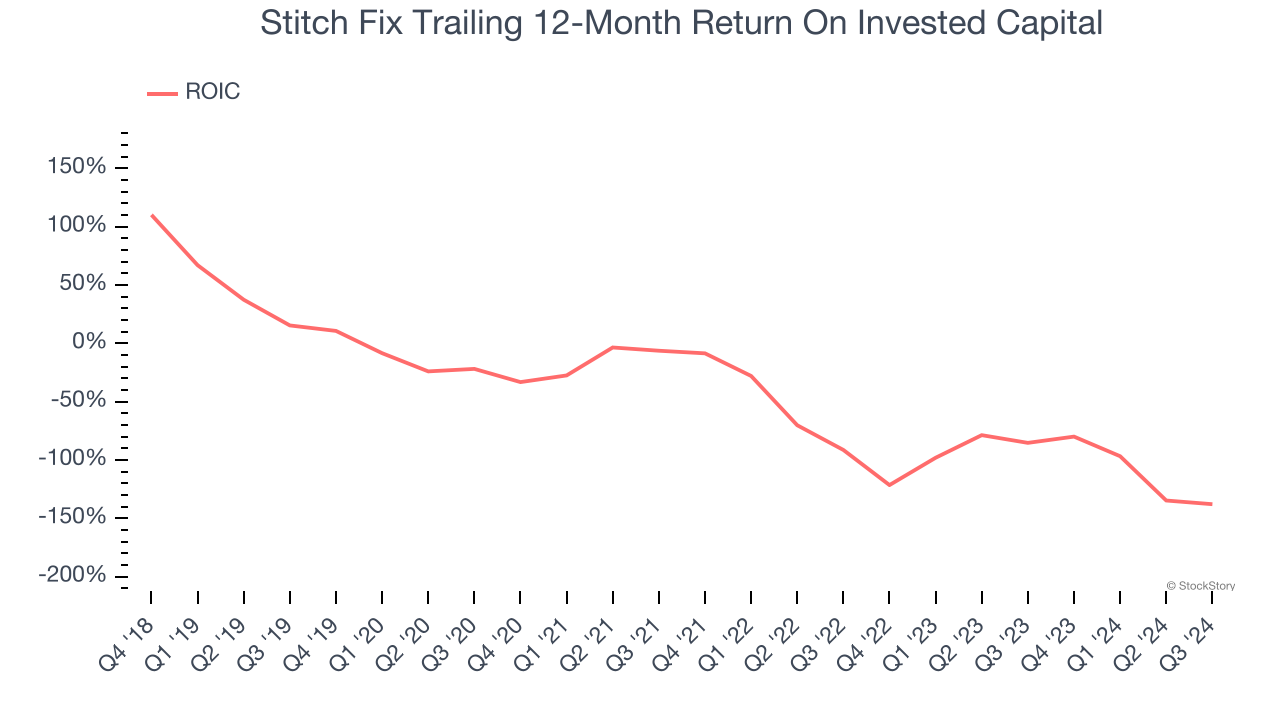
3. New Investments Fail to Bear Fruit as ROIC Declines
A company’s ROIC, or return on invested capital, shows how much operating profit it makes compared to the money it has raised (debt and equity).
We typically prefer to invest in companies with high returns because it means they have viable business models, but the trend in a company’s ROIC is often what surprises the market and moves the stock price. Unfortunately, Stitch Fix’s ROIC has decreased significantly over the last few years. Paired with its already low returns, these declines suggest its profitable growth opportunities are few and far between.
Final Judgment
We see the value of companies helping consumers, but in the case of Stitch Fix, we’re out. That said, the stock currently trades at 47.6× forward EV-to-EBITDA (or $5.11 per share). At this valuation, there’s a lot of good news priced in - you can find better investment opportunities elsewhere. We’d recommend looking at Wabtec, a leading provider of locomotive services benefiting from an upgrade cycle.
Stocks We Like More Than Stitch Fix
With rates dropping, inflation stabilizing, and the elections in the rearview mirror, all signs point to the start of a new bull run - and we’re laser-focused on finding the best stocks for this upcoming cycle.
Put yourself in the driver’s seat by checking out our Top 6 Stocks for this week. This is a curated list of our High Quality stocks that have generated a market-beating return of 175% over the last five years.
Stocks that made our list in 2019 include now familiar names such as Nvidia (+2,183% between December 2019 and December 2024) as well as under-the-radar businesses like Sterling Infrastructure (+1,096% five-year return). Find your next big winner with StockStory today for free.


