As the craze of earnings season draws to a close, here’s a look back at some of the most exciting (and some less so) results from Q3. Today, we are looking at footwear retailer stocks, starting with Designer Brands (NYSE: DBI).
Footwear sales–like their apparel counterparts–are driven by seasons, trends, and innovation more so than absolute need and similarly face the bigger-picture secular trend of e-commerce penetration. Footwear plays a part in societal belonging, personal expression, and occasion, and retailers selling shoes recognize this. Therefore, they aim to balance selection, competitive prices, and the latest trends to attract consumers. Unlike their apparel counterparts, footwear retailers most sell popular third-party brands (as opposed to their own exclusive brands), which could mean less exclusivity of product but more nimbleness to pivot to what’s hot.
The 4 footwear retailer stocks we track reported a slower Q3. As a group, revenues missed analysts’ consensus estimates by 2% while next quarter’s revenue guidance was in line.
Amidst this news, share prices of the companies have had a rough stretch. On average, they are down 7.2% since the latest earnings results.
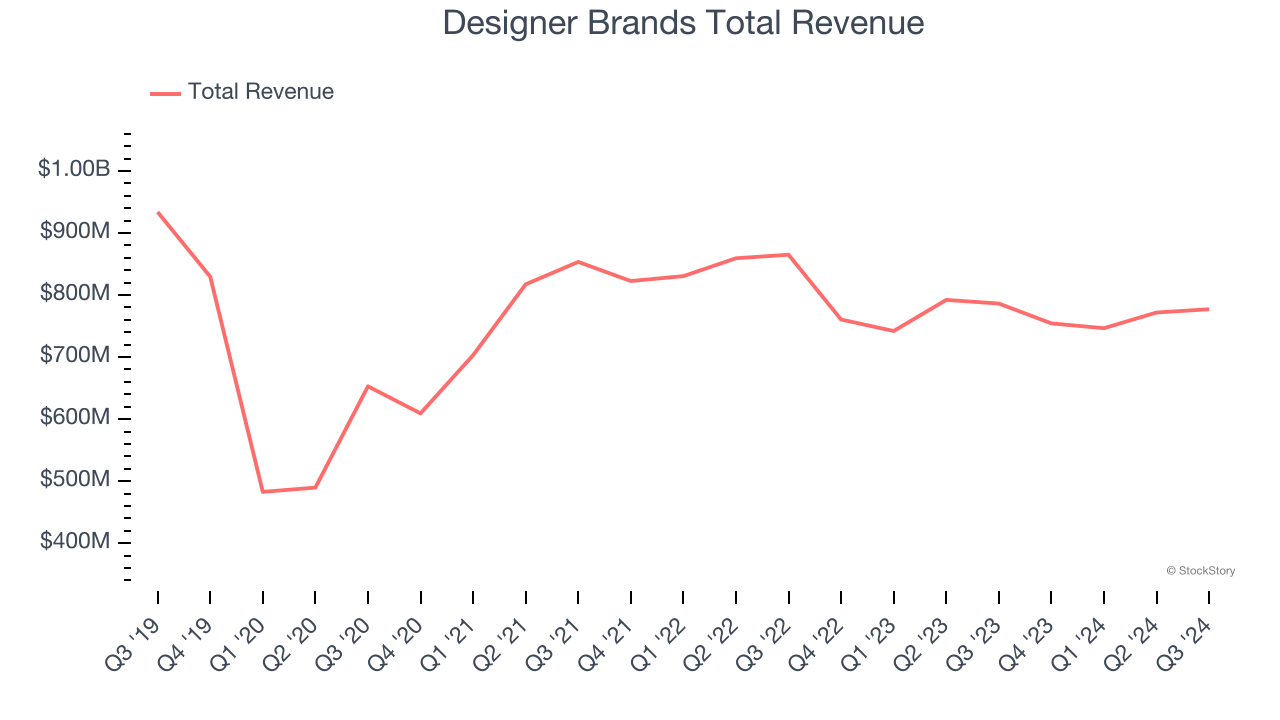
Designer Brands (NYSE: DBI)
Founded in 1969 as a shoe importer and distributor, Designer Brands (NYSE: DBI) is an American discount retailer focused on footwear and accessories.
Designer Brands reported revenues of $777.2 million, down 1.2% year on year. This print fell short of analysts’ expectations by 3.1%. Overall, it was a softer quarter for the company with full-year EPS guidance missing analysts’ expectations significantly and a miss of analysts’ gross margin estimates.
Doug Howe, Chief Executive Officer stated, "The third quarter started strong, driven by back-to-school season and the success of our athletic and athleisure offerings, bolstering our confidence that we had reached a turning point in our business."
Designer Brands delivered the weakest performance against analyst estimates of the whole group. Interestingly, the stock is up 2.8% since reporting and currently trades at $5.94.
Read our full report on Designer Brands here, it’s free.
Best Q3: Boot Barn (NYSE: BOOT)
With a strong store presence in Texas, California, Florida, and Oklahoma, Boot Barn (NYSE: BOOT) is a western-inspired apparel and footwear retailer.
Boot Barn reported revenues of $425.8 million, up 13.7% year on year, in line with analysts’ expectations. The business performed better than its peers, but it was unfortunately a mixed quarter with an impressive beat of analysts’ EBITDA estimates but EPS guidance for next quarter missing analysts’ expectations.
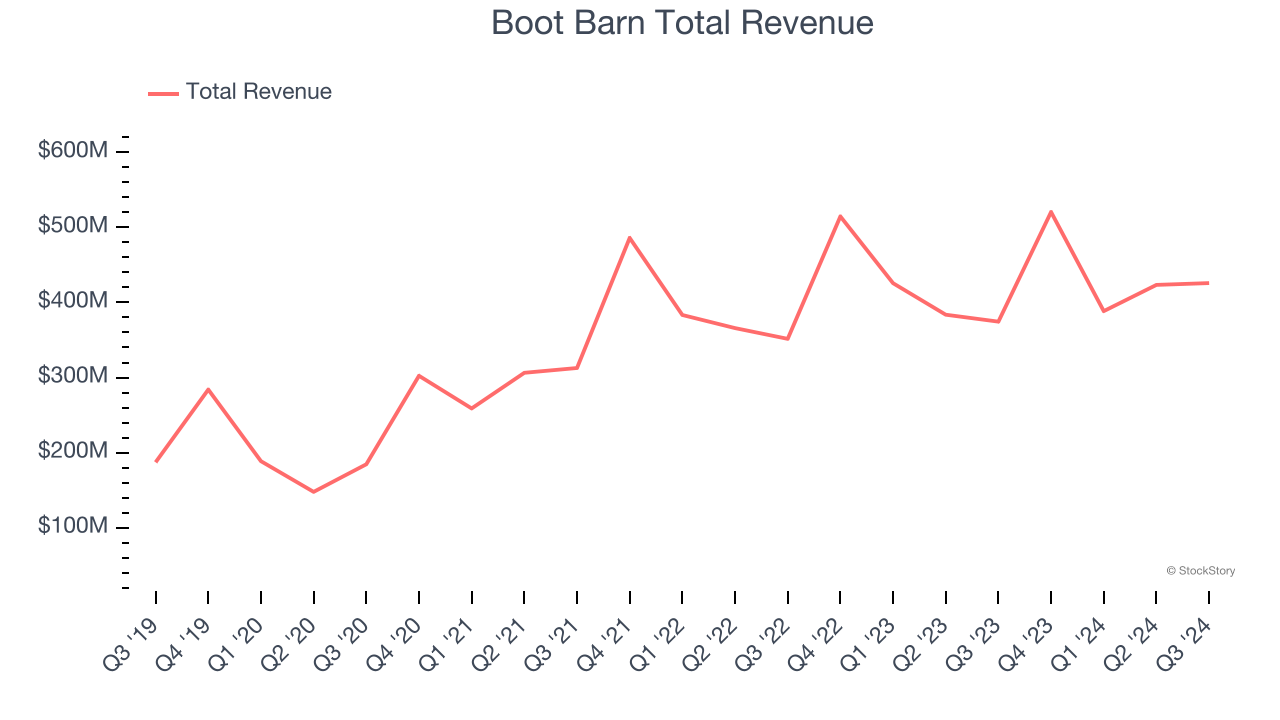
Boot Barn achieved the biggest analyst estimates beat, fastest revenue growth, and highest full-year guidance raise among its peers. Although it had a fine quarter compared to its peers, the market seems unhappy with the results as the stock is down 5.4% since reporting. It currently trades at $152.78.
Is now the time to buy Boot Barn? Access our full analysis of the earnings results here, it’s free.
Weakest Q3: Foot Locker (NYSE: FL)
Known for store associates whose uniforms resemble those of referees, Foot Locker (NYSE: FL) is a specialty retailer that sells athletic footwear, clothing, and accessories.
Foot Locker reported revenues of $1.96 billion, down 1.4% year on year, falling short of analysts’ expectations by 2.1%. It was a disappointing quarter as it posted full-year EPS guidance missing analysts’ expectations significantly and a significant miss of analysts’ EBITDA estimates.
As expected, the stock is down 16% since the results and currently trades at $20.30.
Read our full analysis of Foot Locker’s results here.
Shoe Carnival (NASDAQ: SCVL)
Known for its playful atmosphere that features carnival elements, Shoe Carnival (NASDAQ: SCVL) is a retailer that sells footwear from mainstream brands for the entire family.
Shoe Carnival reported revenues of $306.9 million, down 4.1% year on year. This print came in 3% below analysts' expectations. Overall, it was a slower quarter as it also produced a slight miss of analysts’ gross margin estimates and a slight miss of analysts’ EBITDA estimates.
Shoe Carnival had the slowest revenue growth and weakest full-year guidance update among its peers. The stock is down 10.1% since reporting and currently trades at $30.08.
Read our full, actionable report on Shoe Carnival here, it’s free.
Market Update
The Fed’s interest rate hikes throughout 2022 and 2023 have successfully cooled post-pandemic inflation, bringing it closer to the 2% target. Inflationary pressures have eased without tipping the economy into a recession, suggesting a soft landing. This stability, paired with recent rate cuts (0.5% in September 2024 and 0.25% in November 2024), fueled a strong year for the stock market in 2024. The markets surged further after Donald Trump’s presidential victory in November, with major indices reaching record highs in the days following the election. Still, questions remain about the direction of economic policy, as potential tariffs and corporate tax changes add uncertainty for 2025.
Want to invest in winners with rock-solid fundamentals? Check out our Top 6 Stocks and add them to your watchlist. These companies are poised for growth regardless of the political or macroeconomic climate.
Join Paid Stock Investor Research
Help us make StockStory more helpful to investors like yourself. Join our paid user research session and receive a $50 Amazon gift card for your opinions. Sign up here.