
Wynn Resorts currently trades at $82.40 per share and has shown little upside over the past six months, posting a small loss of 3%. The stock also fell short of the S&P 500’s 6.6% gain during that period.
Is there a buying opportunity in Wynn Resorts, or does it present a risk to your portfolio? Check out our in-depth research report to see what our analysts have to say, it’s free.
We don't have much confidence in Wynn Resorts. Here are three reasons why WYNN doesn't excite us and a stock we'd rather own.
Why Do We Think Wynn Resorts Will Underperform?
Founded by the former Mirage Resorts CEO, Wynn Resorts (NASDAQ: WYNN) is a global developer and operator of high-end hotels and casinos, known for its luxurious properties and premium guest services.
1. Long-Term Revenue Growth Disappoints
A company’s long-term sales performance signals its overall quality. Even a bad business can shine for one or two quarters, but a top-tier one grows for years. Unfortunately, Wynn Resorts’s 1.4% annualized revenue growth over the last five years was weak. This fell short of our benchmarks. 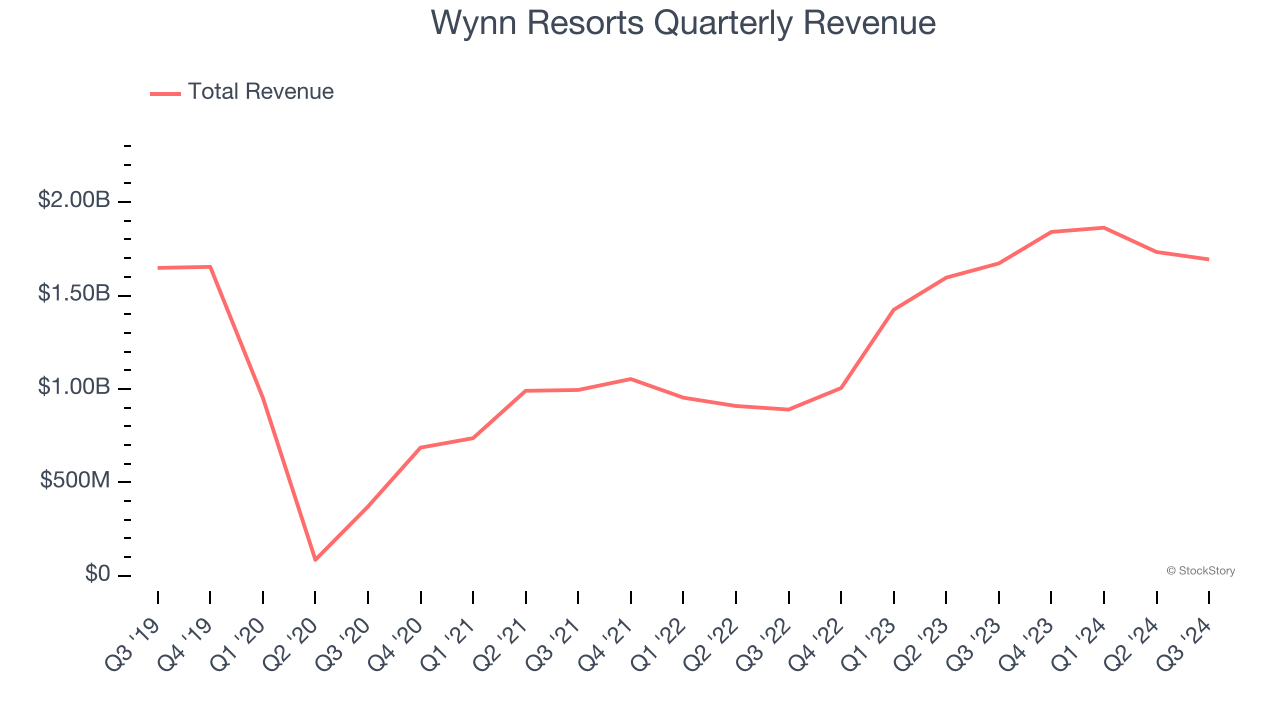
2. Projected Revenue Growth Is Slim
Forecasted revenues by Wall Street analysts signal a company’s potential. Predictions may not always be accurate, but accelerating growth typically boosts valuation multiples and stock prices while slowing growth does the opposite.
Over the next 12 months, sell-side analysts expect Wynn Resorts’s revenue to rise by 1.2%, a deceleration versus its 36.9% annualized growth for the past two years. This projection is underwhelming and suggests its products and services will face some demand challenges.
3. Previous Growth Initiatives Haven’t Paid Off Yet
Growth gives us insight into a company’s long-term potential, but how capital-efficient was that growth? Enter ROIC, a metric showing how much operating profit a company generates relative to the money it has raised (debt and equity).
Wynn Resorts historically did a mediocre job investing in profitable growth initiatives. Its five-year average ROIC was 0.1%, lower than the typical cost of capital (how much it costs to raise money) for consumer discretionary companies.
Final Judgment
Wynn Resorts doesn’t pass our quality test. With its shares lagging the market recently, the stock trades at 15.4× forward price-to-earnings (or $82.40 per share). While this valuation is fair, the upside isn’t great compared to the potential downside. There are more exciting stocks to buy at the moment. We’d suggest looking at Google, whose cloud computing and YouTube divisions are firing on all cylinders.
Stocks We Like More Than Wynn Resorts
With rates dropping, inflation stabilizing, and the elections in the rearview mirror, all signs point to the start of a new bull run - and we’re laser-focused on finding the best stocks for this upcoming cycle.
Put yourself in the driver’s seat by checking out our Top 5 Growth Stocks for this month. This is a curated list of our High Quality stocks that have generated a market-beating return of 175% over the last five years.
Stocks that made our list in 2019 include now familiar names such as Nvidia (+2,183% between December 2019 and December 2024) as well as under-the-radar businesses like Sterling Infrastructure (+1,096% five-year return). Find your next big winner with StockStory today for free.


