
Over the past six months, Levi’s stock price fell to $17.31. Shareholders have lost 6.3% of their capital, which is disappointing considering the S&P 500 has climbed by 7.7%. This may have investors wondering how to approach the situation.
Is now the time to buy Levi's, or should you be careful about including it in your portfolio? See what our analysts have to say in our full research report, it’s free.
Even with the cheaper entry price, we don't have much confidence in Levi's. Here are three reasons why you should be careful with LEVI and a stock we'd rather own.
Why Do We Think Levi's Will Underperform?
Credited for inventing the first pair of blue jeans in 1873, Levi's (NYSE: LEVI) is an apparel company renowned for its iconic denim products and classic American style.
1. Constant Currency Revenue Hits a Standstill
We can better understand Apparel and Accessories companies by analyzing their constant currency revenue. This metric excludes currency movements, which are outside of Levi’s control and are not indicative of underlying demand.
Over the last two years, Levi's failed to grow its constant currency revenue. This performance was underwhelming and implies there may be increasing competition or market saturation. It also suggests Levi's might have to lower prices or invest in product improvements to accelerate growth, factors that can hinder near-term profitability. 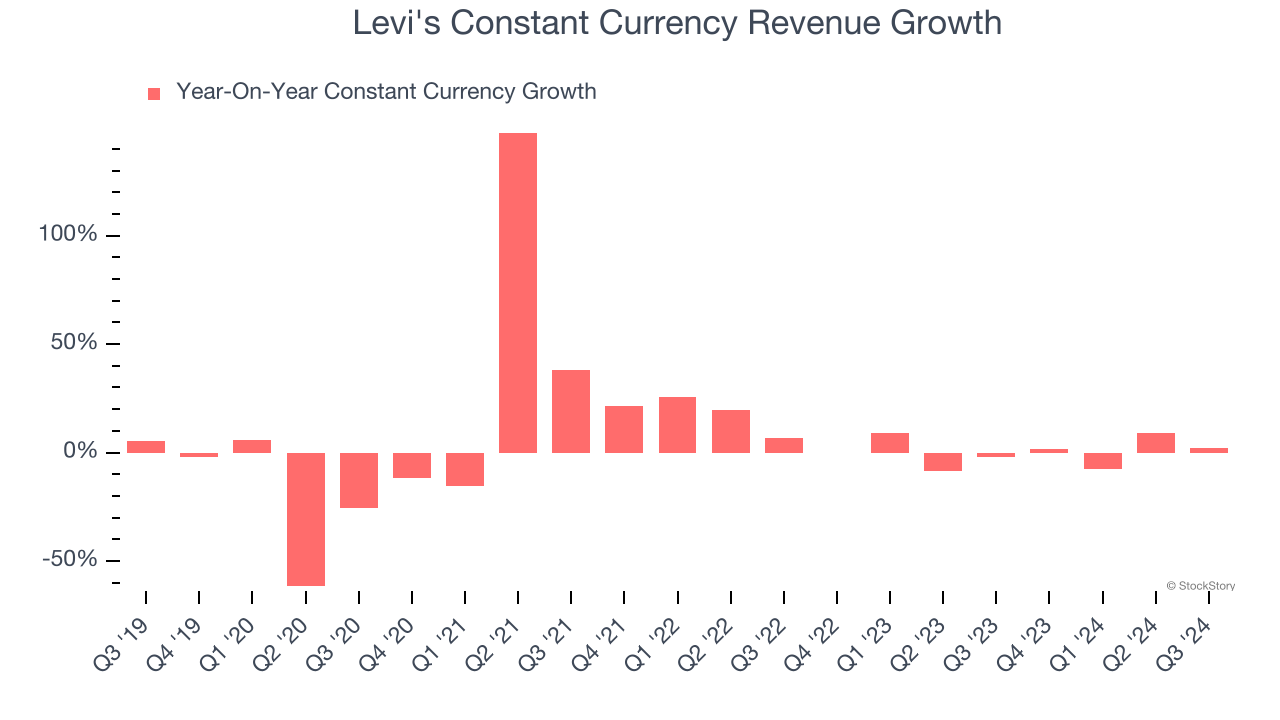
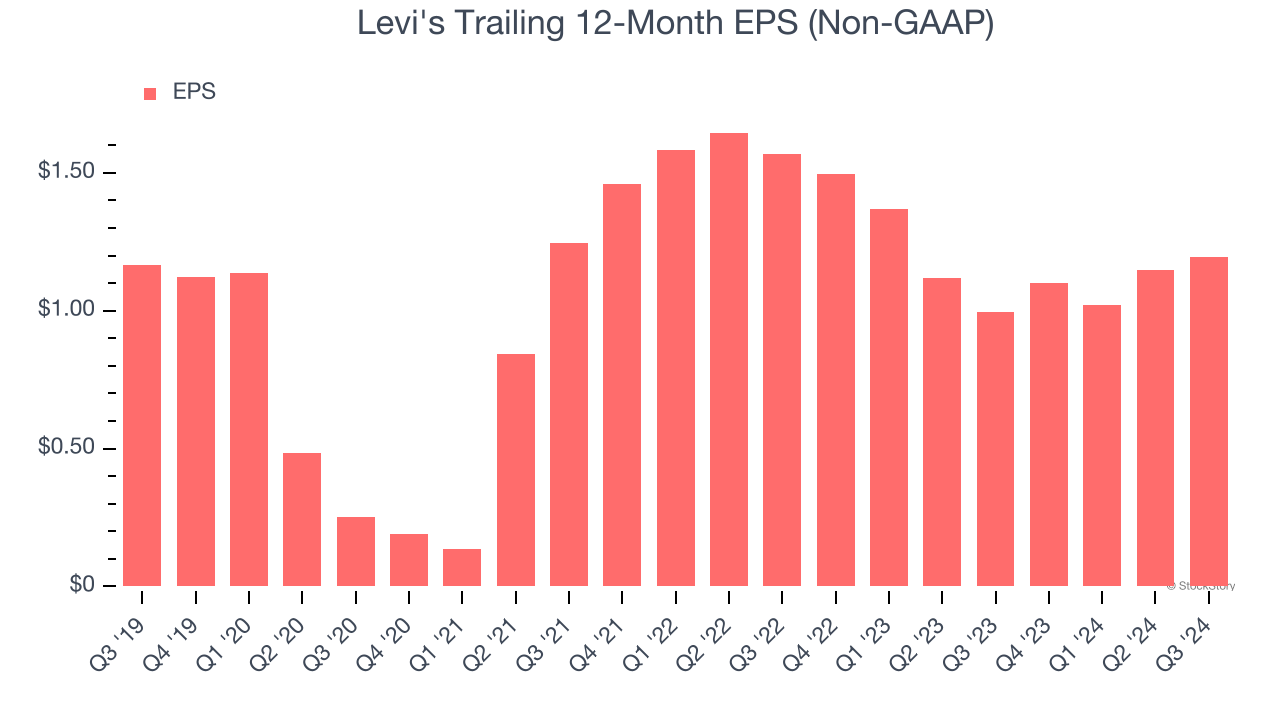
2. EPS Growth Has Stalled
We track the long-term change in earnings per share (EPS) because it highlights whether a company’s growth is profitable.
Levi’s flat EPS over the last five years was below its 1.3% annualized revenue growth. This tells us the company became less profitable on a per-share basis as it expanded.
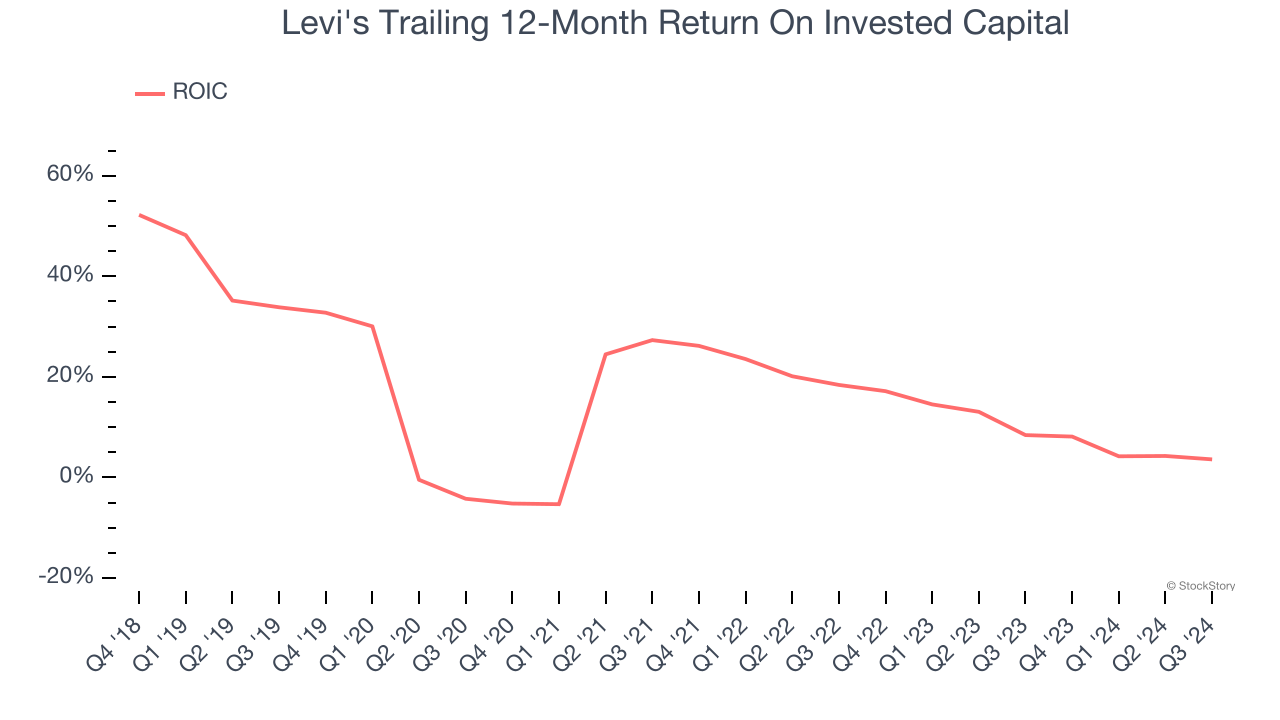
3. New Investments Fail to Bear Fruit as ROIC Declines
A company’s ROIC, or return on invested capital, shows how much operating profit it makes compared to the money it has raised (debt and equity).
We typically prefer to invest in companies with high returns because it means they have viable business models, but the trend in a company’s ROIC is often what surprises the market and moves the stock price. Over the last few years, Levi’s ROIC has decreased. Paired with its already low returns, these declines suggest its profitable growth opportunities are few and far between.
Final Judgment
Levi's doesn’t pass our quality test. After the recent drawdown, the stock trades at 12.2× forward price-to-earnings (or $17.31 per share). While this valuation is fair, the upside isn’t great compared to the potential downside. There are more exciting stocks to buy at the moment. We’d recommend looking at Wabtec, a leading provider of locomotive services benefiting from an upgrade cycle.
Stocks We Like More Than Levi's
The elections are now behind us. With rates dropping and inflation cooling, many analysts expect a breakout market - and we’re zeroing in on the stocks that could benefit immensely.
Take advantage of the rebound by checking out our Top 9 Market-Beating Stocks. This is a curated list of our High Quality stocks that have generated a market-beating return of 175% over the last five years.
Stocks that made our list in 2019 include now familiar names such as Nvidia (+2,183% between December 2019 and December 2024) as well as under-the-radar businesses like Comfort Systems (+751% five-year return). Find your next big winner with StockStory today for free.


