
Over the past six months, Western Digital’s stock price fell to $64.51. Shareholders have lost 11.7% of their capital, which is disappointing considering the S&P 500 has climbed by 7.7%. This may have investors wondering how to approach the situation.
Is now the time to buy Western Digital, or should you be careful about including it in your portfolio? Dive into our full research report to see our analyst team’s opinion, it’s free.
Even though the stock has become cheaper, we're sitting this one out for now. Here are three reasons why there are better opportunities than WDC and a stock we'd rather own.
Why Do We Think Western Digital Will Underperform?
Founded in 1970 by a Motorola employee, Western Digital (NASDAQ: WDC) is a leading producer of hard disk drives, SSDs and flash memory.
1. Revenue Spiraling Downwards
A company’s long-term sales performance signals its overall quality. Even a bad business can shine for one or two quarters, but a top-tier one grows for years. Western Digital’s demand was weak over the last five years as its sales fell at a 1.6% annual rate. This was below our standards and signals it’s a low quality business. Semiconductors are a cyclical industry, and long-term investors should be prepared for periods of high growth followed by periods of revenue contractions.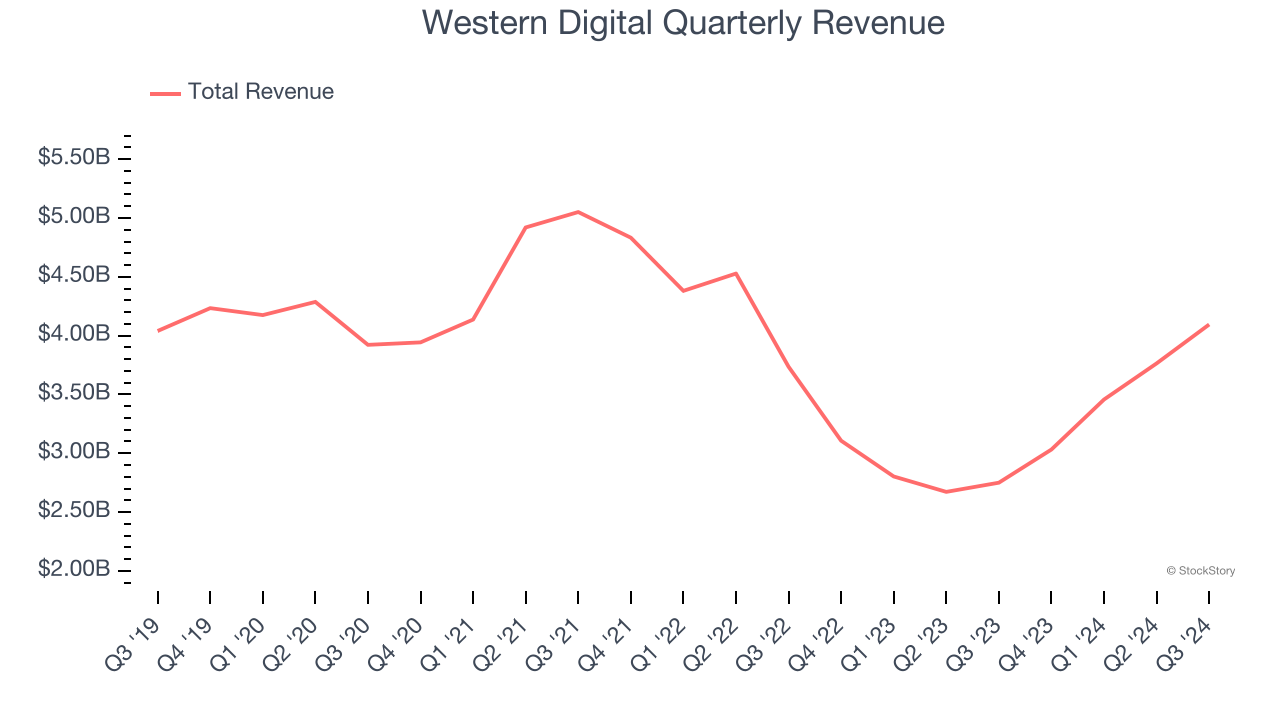
2. Low Gross Margin Reveals Weak Structural Profitability
Gross profit margin is a key metric to track because it shows how much money a semiconductor company gets to keep after paying for its raw materials, manufacturing, and other input costs.
Western Digital’s gross margin is one of the worst in the semiconductor industry, signaling it operates in a competitive market and lacks pricing power. As you can see below, it averaged a 20.9% gross margin over the last two years. That means Western Digital paid its suppliers a lot of money ($79.11 for every $100 in revenue) to run its business. 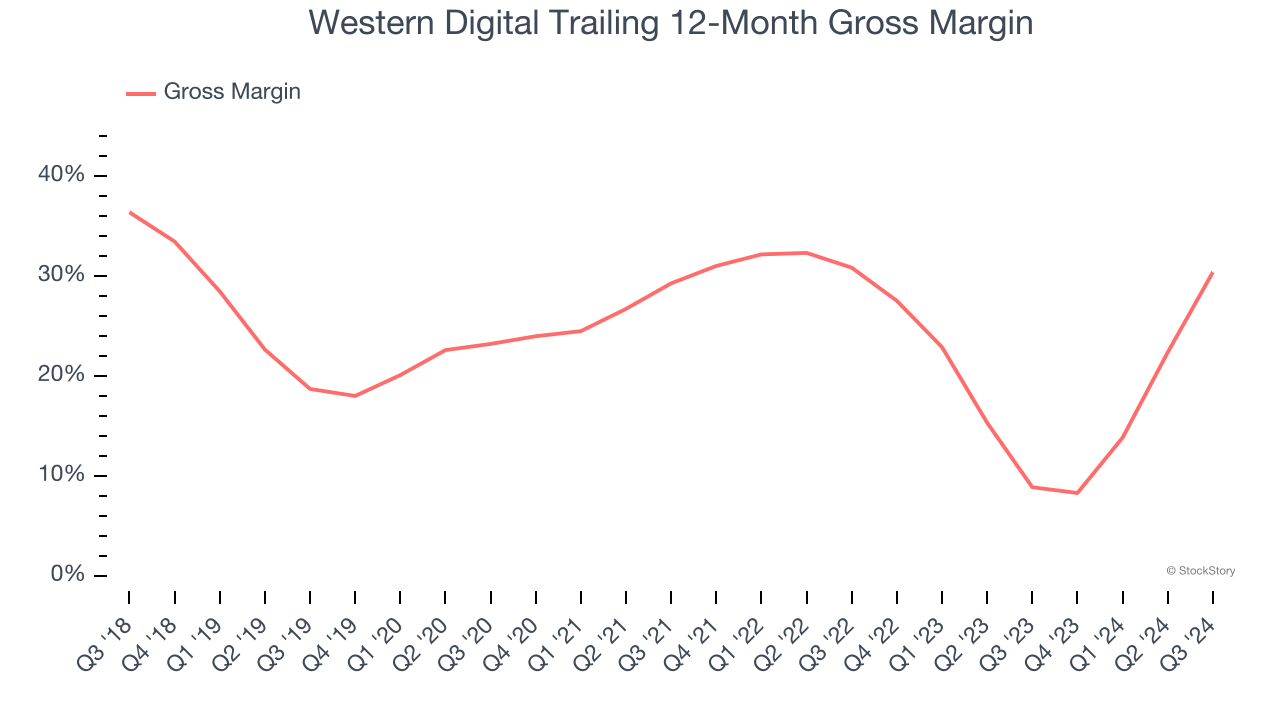
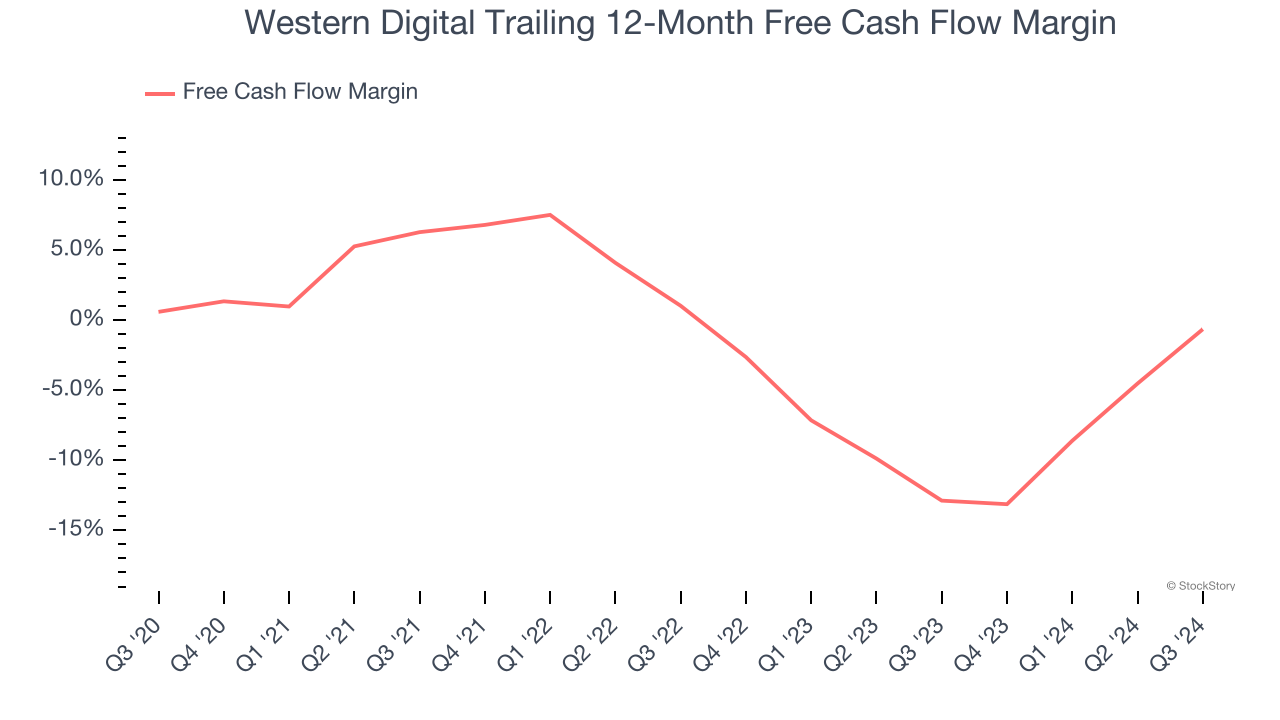
3. Cash Burn Ignites Concerns
Free cash flow isn't a prominently featured metric in company financials and earnings releases, but we think it's telling because it accounts for all operating and capital expenses, making it tough to manipulate. Cash is king.
Western Digital’s demanding reinvestments have drained its resources over the last two years, putting it in a pinch and limiting its ability to return capital to investors. Its free cash flow margin averaged negative 6%, meaning it lit $6.03 of cash on fire for every $100 in revenue.
Final Judgment
Western Digital doesn’t pass our quality test. After the recent drawdown, the stock trades at 7.9× forward price-to-earnings (or $64.51 per share). While this valuation is optically cheap, the potential downside is huge given its shaky fundamentals. There are more exciting stocks to buy at the moment. Let us point you toward Microsoft, the most dominant software business in the world.
Stocks We Like More Than Western Digital
The Trump trade may have passed, but rates are still dropping and inflation is still cooling. Opportunities are ripe for those ready to act - and we’re here to help you pick them.
Get started by checking out our Top 5 Growth Stocks for this month. This is a curated list of our High Quality stocks that have generated a market-beating return of 175% over the last five years.
Stocks that made our list in 2019 include now familiar names such as Nvidia (+2,183% between December 2019 and December 2024) as well as under-the-radar businesses like Comfort Systems (+751% five-year return). Find your next big winner with StockStory today for free.