As the Q3 earnings season wraps, let’s dig into this quarter’s best and worst performers in the footwear retailer industry, including Shoe Carnival (NASDAQ: SCVL) and its peers.
Footwear sales–like their apparel counterparts–are driven by seasons, trends, and innovation more so than absolute need and similarly face the bigger-picture secular trend of e-commerce penetration. Footwear plays a part in societal belonging, personal expression, and occasion, and retailers selling shoes recognize this. Therefore, they aim to balance selection, competitive prices, and the latest trends to attract consumers. Unlike their apparel counterparts, footwear retailers most sell popular third-party brands (as opposed to their own exclusive brands), which could mean less exclusivity of product but more nimbleness to pivot to what’s hot.
The 4 footwear retailer stocks we track reported a slower Q3. As a group, revenues missed analysts’ consensus estimates by 2% while next quarter’s revenue guidance was in line.
Amidst this news, share prices of the companies have had a rough stretch. On average, they are down 5.4% since the latest earnings results.
Shoe Carnival (NASDAQ: SCVL)
Known for its playful atmosphere that features carnival elements, Shoe Carnival (NASDAQ: SCVL) is a retailer that sells footwear from mainstream brands for the entire family.
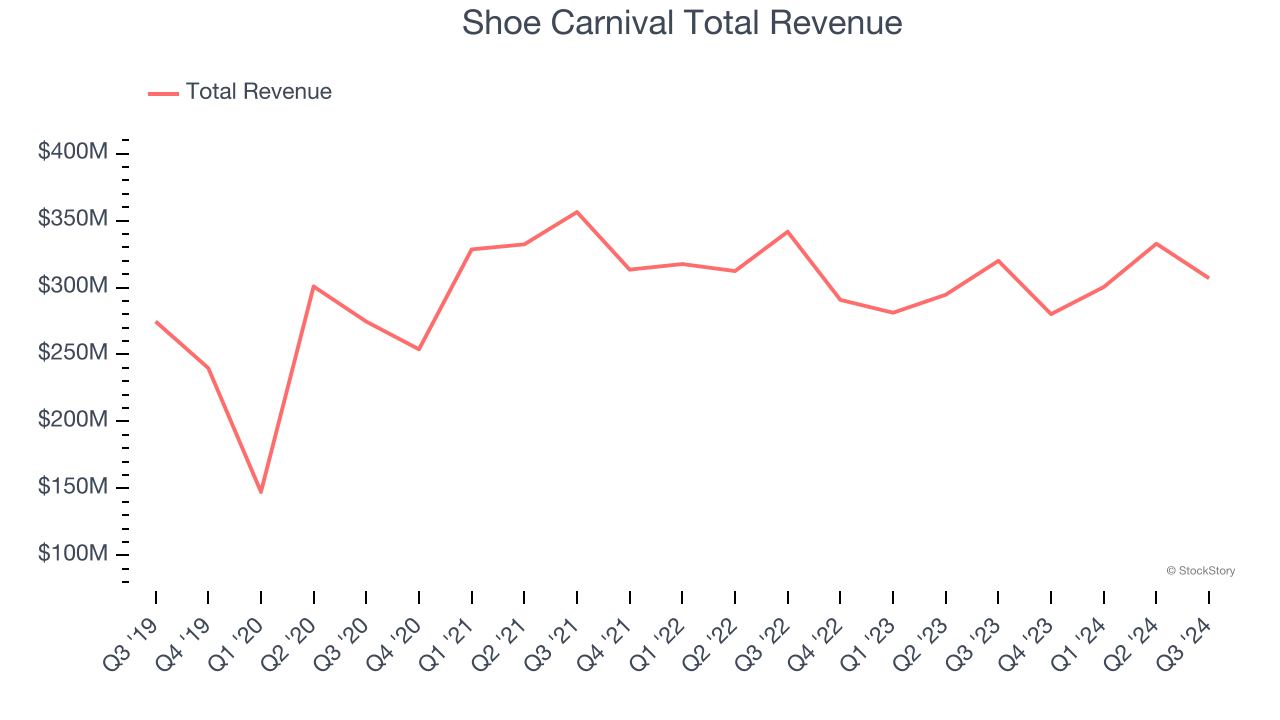
Shoe Carnival reported revenues of $306.9 million, down 4.1% year on year. This print fell short of analysts’ expectations by 3%. Overall, it was a slower quarter for the company with a slight miss of analysts’ gross margin and EBITDA estimates.
“Our Back-to-School results were strong, with comparable store sales growth across our banners and robust margins. Our flexible digital-first marketing campaign and great brand assortment drove demand during this peak shopping period and profitability in line with expectations for the third quarter. I am very proud of our team for delivering the Company’s profit results despite two significant hurricanes disrupting third quarter sales and a very warm October that delayed the start of our winter boot season,” said Mark Worden, President and Chief Executive Officer.
Shoe Carnival delivered the slowest revenue growth and weakest full-year guidance update of the whole group. Unsurprisingly, the stock is down 9.8% since reporting and currently trades at $30.19.
Read our full report on Shoe Carnival here, it’s free.
Best Q3: Boot Barn (NYSE: BOOT)
With a strong store presence in Texas, California, Florida, and Oklahoma, Boot Barn (NYSE: BOOT) is a western-inspired apparel and footwear retailer.
Boot Barn reported revenues of $425.8 million, up 13.7% year on year, in line with analysts’ expectations. The business performed better than its peers, but it was unfortunately a mixed quarter with a solid beat of analysts’ EBITDA estimates but EPS guidance for next quarter missing analysts’ expectations.
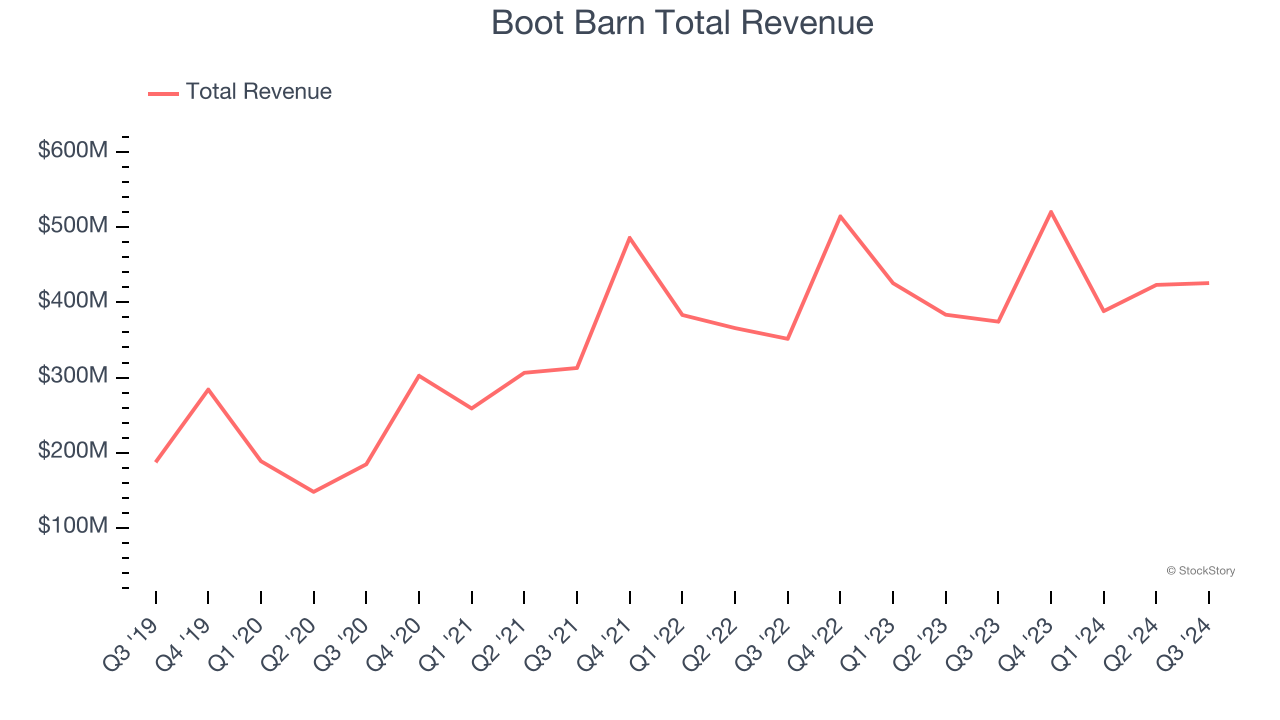
Boot Barn achieved the biggest analyst estimates beat, fastest revenue growth, and highest full-year guidance raise among its peers. The market seems content with the results as the stock is up 4.5% since reporting. It currently trades at $168.75.
Is now the time to buy Boot Barn? Access our full analysis of the earnings results here, it’s free.
Weakest Q3: Foot Locker (NYSE: FL)
Known for store associates whose uniforms resemble those of referees, Foot Locker (NYSE: FL) is a specialty retailer that sells athletic footwear, clothing, and accessories.
Foot Locker reported revenues of $1.96 billion, down 1.4% year on year, falling short of analysts’ expectations by 2.1%. It was a disappointing quarter as it posted full-year EPS guidance missing analysts’ expectations.
As expected, the stock is down 14.1% since the results and currently trades at $20.77.
Read our full analysis of Foot Locker’s results here.
Designer Brands (NYSE: DBI)
Founded in 1969 as a shoe importer and distributor, Designer Brands (NYSE: DBI) is an American discount retailer focused on footwear and accessories.
Designer Brands reported revenues of $777.2 million, down 1.2% year on year. This result missed analysts’ expectations by 3.1%. It was a softer quarter as it also recorded full-year EPS guidance missing analysts’ expectations.
Designer Brands had the weakest performance against analyst estimates among its peers. The stock is down 2.1% since reporting and currently trades at $5.66.
Read our full, actionable report on Designer Brands here, it’s free.
Market Update
In response to the Fed's rate hikes in 2022 and 2023, inflation has been gradually trending down from its post-pandemic peak, trending closer to the Fed's 2% target. Despite higher borrowing costs, the economy has avoided flashing recessionary signals. This is the much-desired soft landing that many investors hoped for. The recent rate cuts (0.5% in September and 0.25% in November 2024) have bolstered the stock market, making 2024 a strong year for equities. Donald Trump’s presidential win in November sparked additional market gains, sending indices to record highs in the days following his victory. However, debates continue over possible tariffs and corporate tax adjustments, raising questions about economic stability in 2025.
Want to invest in winners with rock-solid fundamentals? Check out our Top 5 Quality Compounder Stocks and add them to your watchlist. These companies are poised for growth regardless of the political or macroeconomic climate.
Join Paid Stock Investor Research
Help us make StockStory more helpful to investors like yourself. Join our paid user research session and receive a $50 Amazon gift card for your opinions. Sign up here.


