
Denim clothing company Levi's (NYSE: LEVI) beat Wall Street’s revenue expectations in Q4 CY2024, with sales up 12% year on year to $1.84 billion. Its non-GAAP profit of $0.50 per share was 3.7% above analysts’ consensus estimates.
Is now the time to buy Levi's? Find out by accessing our full research report, it’s free.
Levi's (LEVI) Q4 CY2024 Highlights:
- Revenue: $1.84 billion vs analyst estimates of $1.73 billion (12% year-on-year growth, 6.6% beat)
- Adjusted EPS: $0.50 vs analyst estimates of $0.48 (3.7% beat)
- Adjusted EBITDA: $301.2 million vs analyst estimates of $285.3 million (16.4% margin, 5.6% beat)
- Adjusted EPS guidance for the upcoming financial year 2025 is $1.23 at the midpoint, missing analyst estimates by 10.8%
- Operating Margin: 11.5%, up from 9.2% in the same quarter last year
- Free Cash Flow Margin: 12.6%, similar to the same quarter last year
- Constant Currency Revenue rose 8% year on year (1.8% in the same quarter last year)
- Market Capitalization: $7.28 billion
Company Overview
Credited for inventing the first pair of blue jeans in 1873, Levi's (NYSE: LEVI) is an apparel company renowned for its iconic denim products and classic American style.
Apparel and Accessories
Thanks to social media and the internet, not only are styles changing more frequently today than in decades past but also consumers are shifting the way they buy their goods, favoring omnichannel and e-commerce experiences. Some apparel and accessories companies have made concerted efforts to adapt while those who are slower to move may fall behind.
Sales Growth
A company’s long-term sales performance signals its overall quality. Even a bad business can shine for one or two quarters, but a top-tier one grows for years. Regrettably, Levi’s sales grew at a weak 2% compounded annual growth rate over the last five years. This was below our standards and is a rough starting point for our analysis.
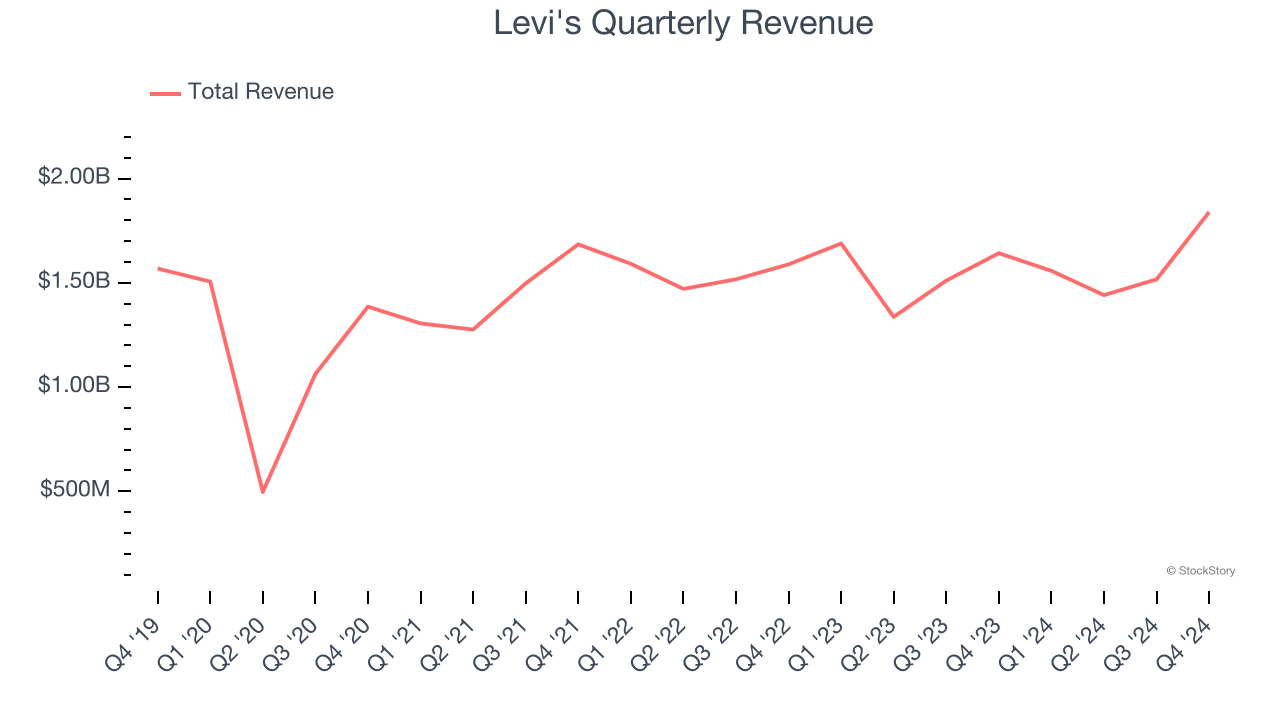
Long-term growth is the most important, but within consumer discretionary, product cycles are short and revenue can be hit-driven due to rapidly changing trends and consumer preferences. Levi’s annualized revenue growth of 1.5% over the last two years aligns with its five-year trend, suggesting its demand was consistently weak. 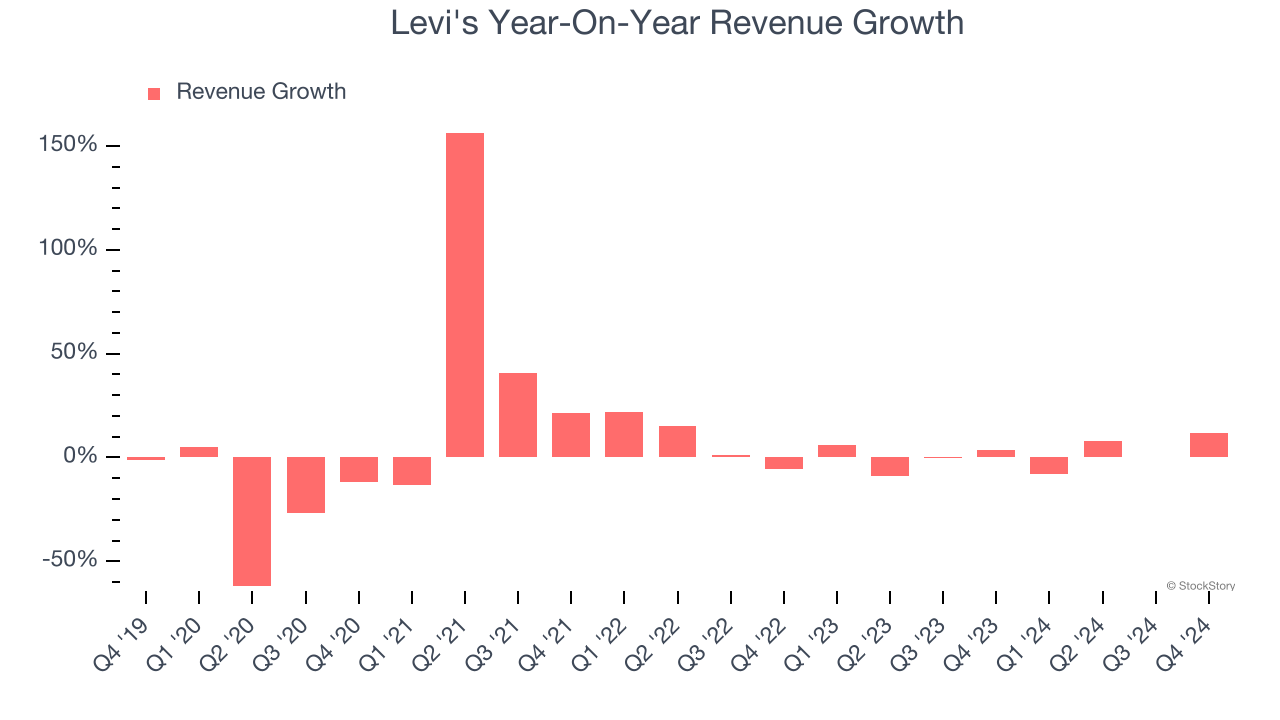
We can dig further into the company’s sales dynamics by analyzing its constant currency revenue, which excludes currency movements that are outside their control and not indicative of demand. Over the last two years, its constant currency sales averaged 1.4% year-on-year growth. Because this number aligns with its normal revenue growth, we can see Levi’s foreign exchange rates have been steady. 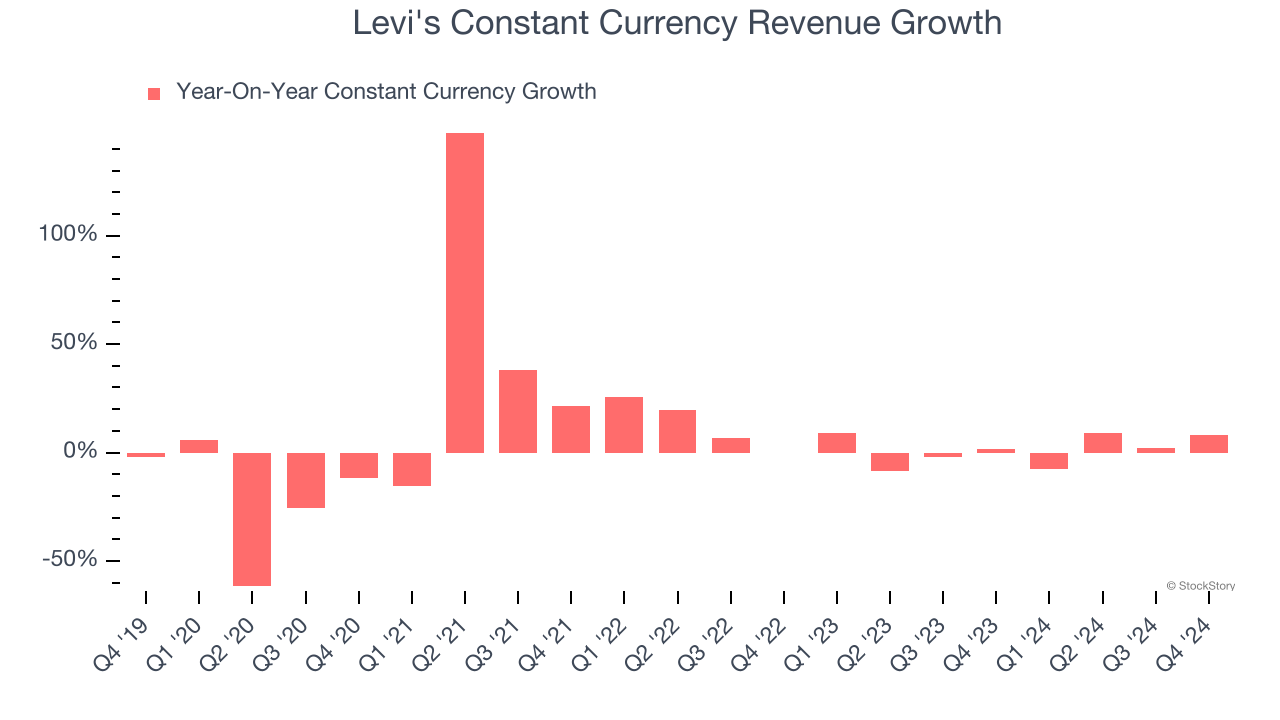
This quarter, Levi's reported year-on-year revenue growth of 12%, and its $1.84 billion of revenue exceeded Wall Street’s estimates by 6.6%.
Looking ahead, sell-side analysts expect revenue to grow 1.7% over the next 12 months, similar to its two-year rate. This projection is underwhelming and indicates its newer products and services will not catalyze better top-line performance yet.
Here at StockStory, we certainly understand the potential of thematic investing. Diverse winners from Microsoft (MSFT) to Alphabet (GOOG), Coca-Cola (KO) to Monster Beverage (MNST) could all have been identified as promising growth stories with a megatrend driving the growth. So, in that spirit, we’ve identified a relatively under-the-radar profitable growth stock benefiting from the rise of AI, available to you FREE via this link.
Cash Is King
If you’ve followed StockStory for a while, you know we emphasize free cash flow. Why, you ask? We believe that in the end, cash is king, and you can’t use accounting profits to pay the bills.
Levi's has shown weak cash profitability over the last two years, giving the company limited opportunities to return capital to shareholders. Its free cash flow margin averaged 6.3%, subpar for a consumer discretionary business.
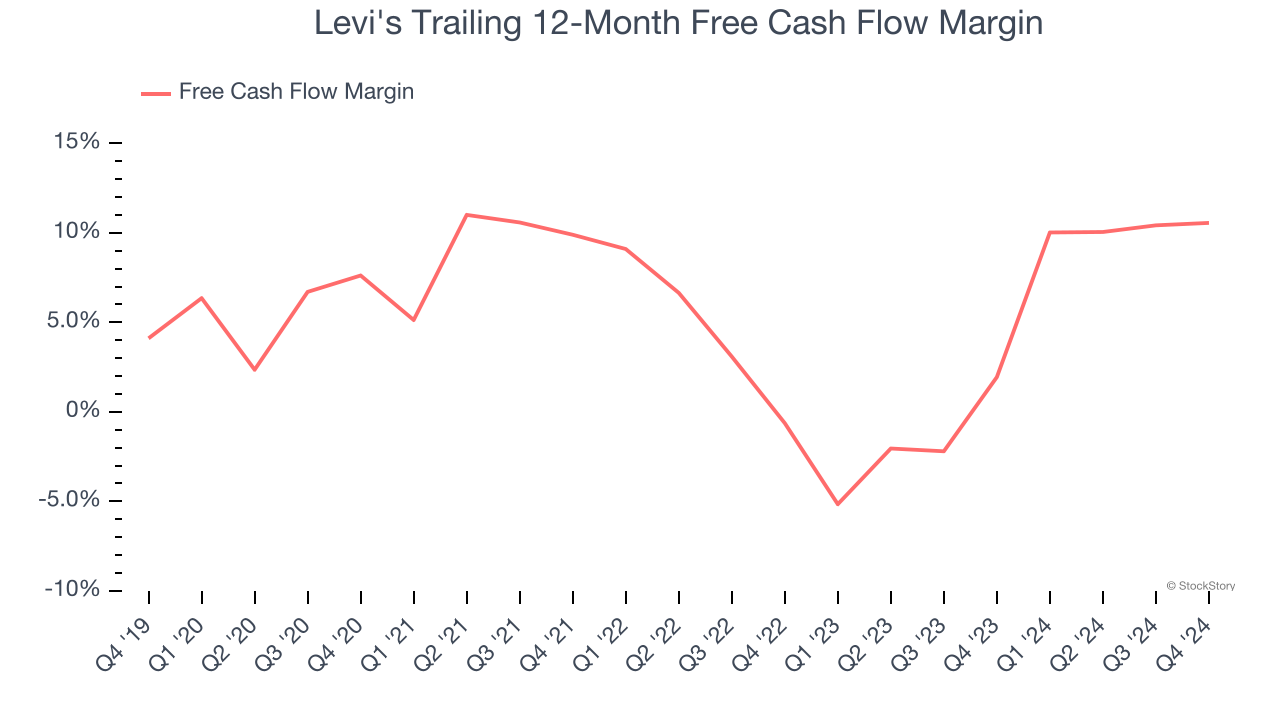
Levi’s free cash flow clocked in at $231.6 million in Q4, equivalent to a 12.6% margin. This cash profitability was in line with the comparable period last year and above its two-year average.
Key Takeaways from Levi’s Q4 Results
We enjoyed seeing Levi's exceed analysts’ revenue expectations this quarter. We were also glad its constant currency revenue outperformed Wall Street’s estimates. On the other hand, its full-year EPS guidance missed significantly. Zooming out, we think this was a decent quarter, but the outlook is weighing on shares. The stock traded down 3.2% to $17.50 immediately following the results.
Should you buy the stock or not? When making that decision, it’s important to consider its valuation, business qualities, as well as what has happened in the latest quarter. We cover that in our actionable full research report which you can read here, it’s free.


