Semi trailers and liquid transportation container manufacturer Wabash (NYSE: WNC) reported Q4 CY2024 results beating Wall Street’s revenue expectations, but sales fell by 30.1% year on year to $416.8 million. The company’s full-year revenue guidance of $2 billion at the midpoint came in 3.5% above analysts’ estimates. Its GAAP loss of $0.02 per share was significantly below analysts’ consensus estimates.
Is now the time to buy Wabash? Find out by accessing our full research report, it’s free.
Wabash (WNC) Q4 CY2024 Highlights:
- Revenue: $416.8 million vs analyst estimates of $412.9 million (30.1% year-on-year decline, 0.9% beat)
- EPS (GAAP): -$0.02 vs analyst estimates of $0.03 (significant miss)
- Adjusted EBITDA: $21.11 million vs analyst estimates of $38.18 million (5.1% margin, 44.7% miss)
- Management’s revenue guidance for the upcoming financial year 2025 is $2 billion at the midpoint, beating analyst estimates by 3.5% and implying 2.7% growth (vs -23.4% in FY2024)
- EPS (GAAP) guidance for the upcoming financial year 2025 is $0.95 at the midpoint, missing analyst estimates by 23.4%
- Operating Margin: 0.9%, down from 10.3% in the same quarter last year
- Free Cash Flow Margin: 14.3%, down from 16.8% in the same quarter last year
- Backlog: $1.2 billion at quarter end, down 36.8% year on year
- Market Capitalization: $677.8 million
Company Overview
With its first trailer reportedly built on two sawhorses, Wabash (NYSE: WNC) offers semi trailers, liquid transportation containers, truck bodies, and equipment for moving goods.
Heavy Transportation Equipment
Heavy transportation equipment companies are investing in automated vehicles that increase efficiencies and connected machinery that collects actionable data. Some are also developing electric vehicles and mobility solutions to address customers’ concerns about carbon emissions, creating new sales opportunities. Additionally, they are increasingly offering automated equipment that increases efficiencies and connected machinery that collects actionable data. On the other hand, heavy transportation equipment companies are at the whim of economic cycles. Interest rates, for example, can greatly impact the construction and transport volumes that drive demand for these companies’ offerings.
Sales Growth
Reviewing a company’s long-term sales performance reveals insights into its quality. Any business can have short-term success, but a top-tier one grows for years. Wabash’s demand was weak over the last five years as its sales fell at a 3.4% annual rate. This fell short of our benchmarks and signals it’s a low quality business.
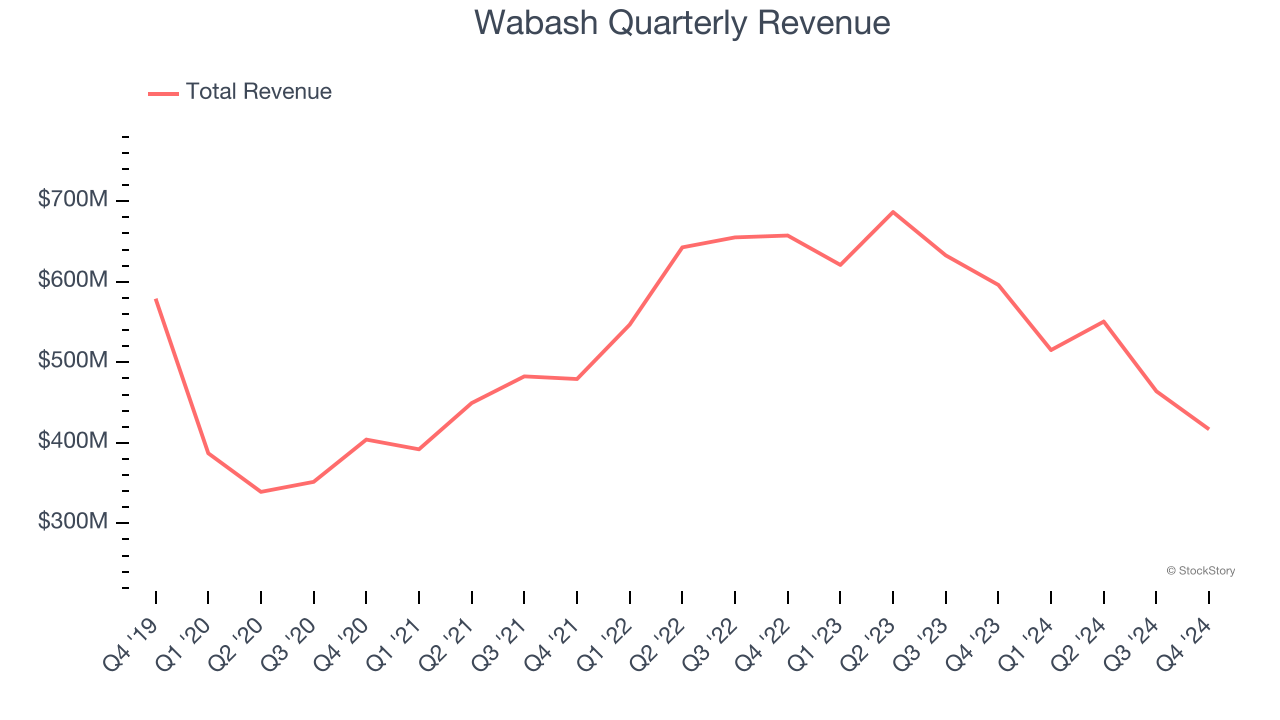
Long-term growth is the most important, but within industrials, a half-decade historical view may miss new industry trends or demand cycles. Wabash’s recent history shows its demand has stayed suppressed as its revenue has declined by 11.8% annually over the last two years. Wabash isn’t alone in its struggles as the Heavy Transportation Equipment industry experienced a cyclical downturn, with many similar businesses observing lower sales at this time. 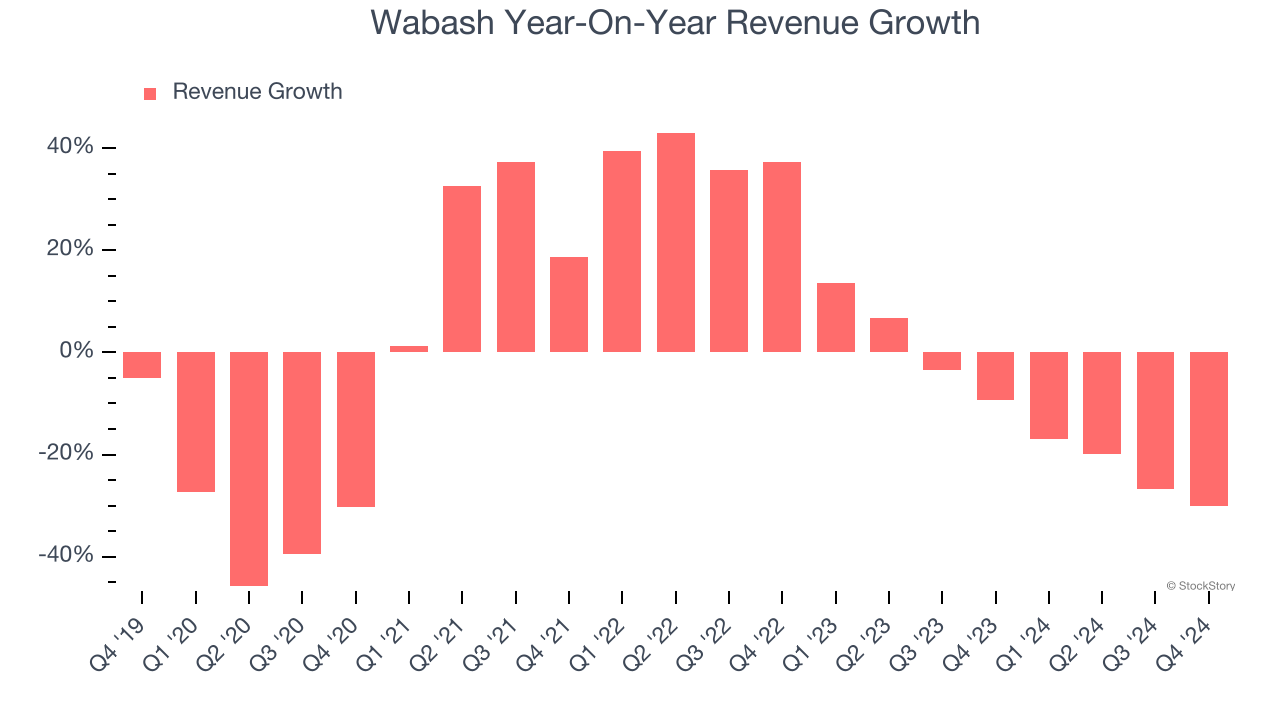
We can dig further into the company’s revenue dynamics by analyzing its backlog, or the value of its outstanding orders that have not yet been executed or delivered. Wabash’s backlog reached $1.2 billion in the latest quarter and averaged 24.3% year-on-year declines over the last two years. Because this number is lower than its revenue growth, we can see the company hasn’t secured enough new orders to maintain its growth rate in the future. 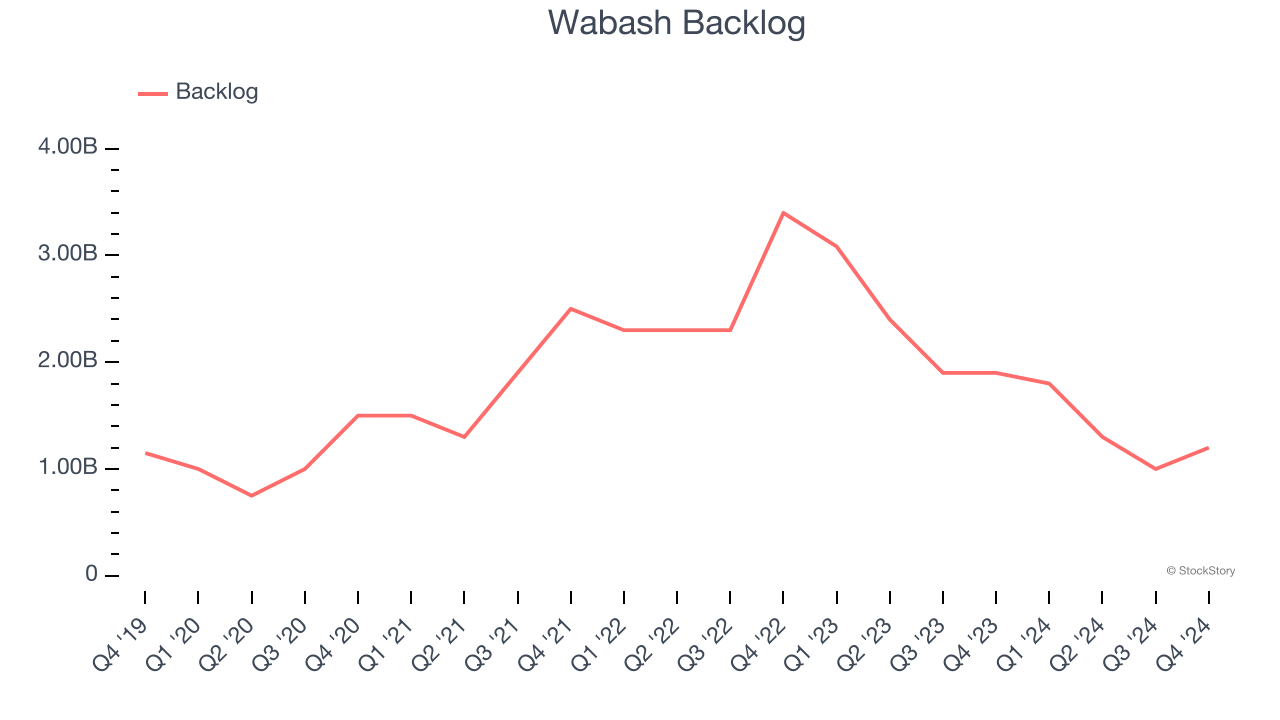
This quarter, Wabash’s revenue fell by 30.1% year on year to $416.8 million but beat Wall Street’s estimates by 0.9%.
Looking ahead, sell-side analysts expect revenue to decline by 2.7% over the next 12 months. Although this projection is better than its two-year trend, it's tough to feel optimistic about a company facing demand difficulties.
Software is eating the world and there is virtually no industry left that has been untouched by it. That drives increasing demand for tools helping software developers do their jobs, whether it be monitoring critical cloud infrastructure, integrating audio and video functionality, or ensuring smooth content streaming. Click here to access a free report on our 3 favorite stocks to play this generational megatrend.
Operating Margin
Wabash was roughly breakeven when averaging the last five years of quarterly operating profits, inadequate for an industrials business. This result isn’t too surprising given its low gross margin as a starting point.
Looking at the trend in its profitability, Wabash’s operating margin decreased by 12.5 percentage points over the last five years. The company’s performance was poor no matter how you look at it. It shows operating expenses were rising and it couldn’t pass those costs onto its customers.
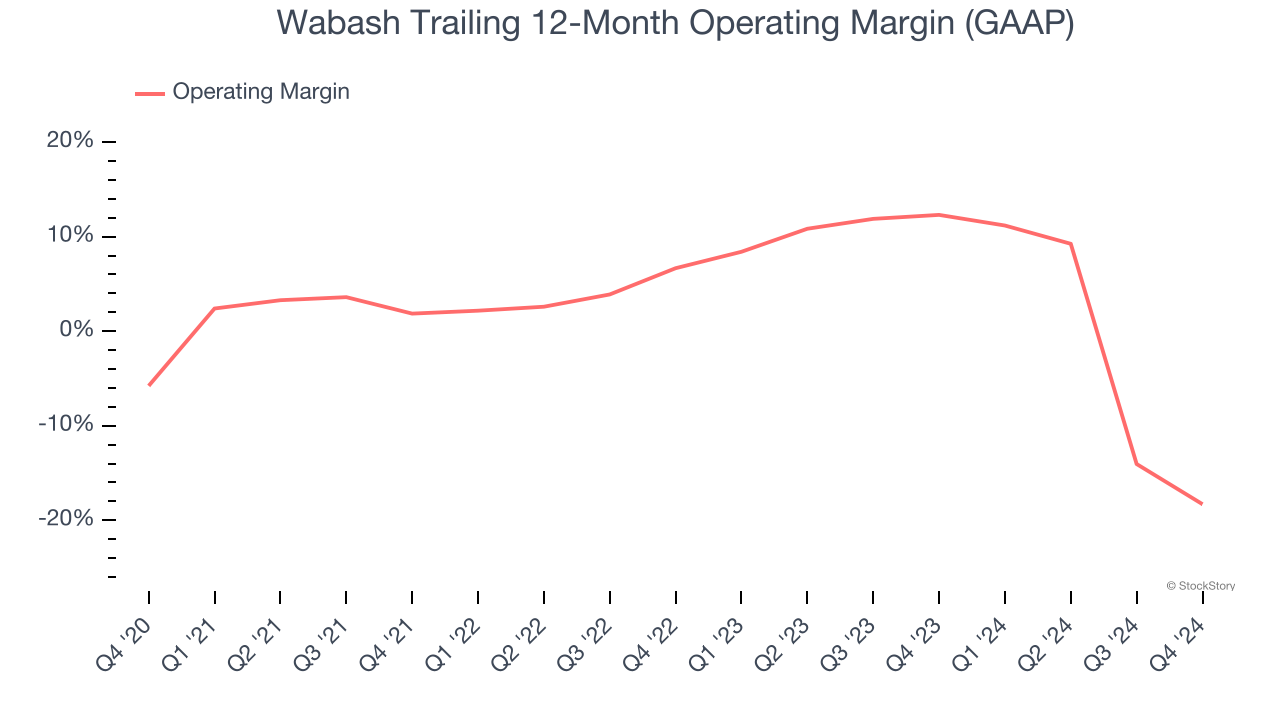
In Q4, Wabash’s breakeven margin was down 9.4 percentage points year on year. Since Wabash’s operating margin decreased more than its gross margin, we can assume it was recently less efficient because expenses such as marketing, R&D, and administrative overhead increased.
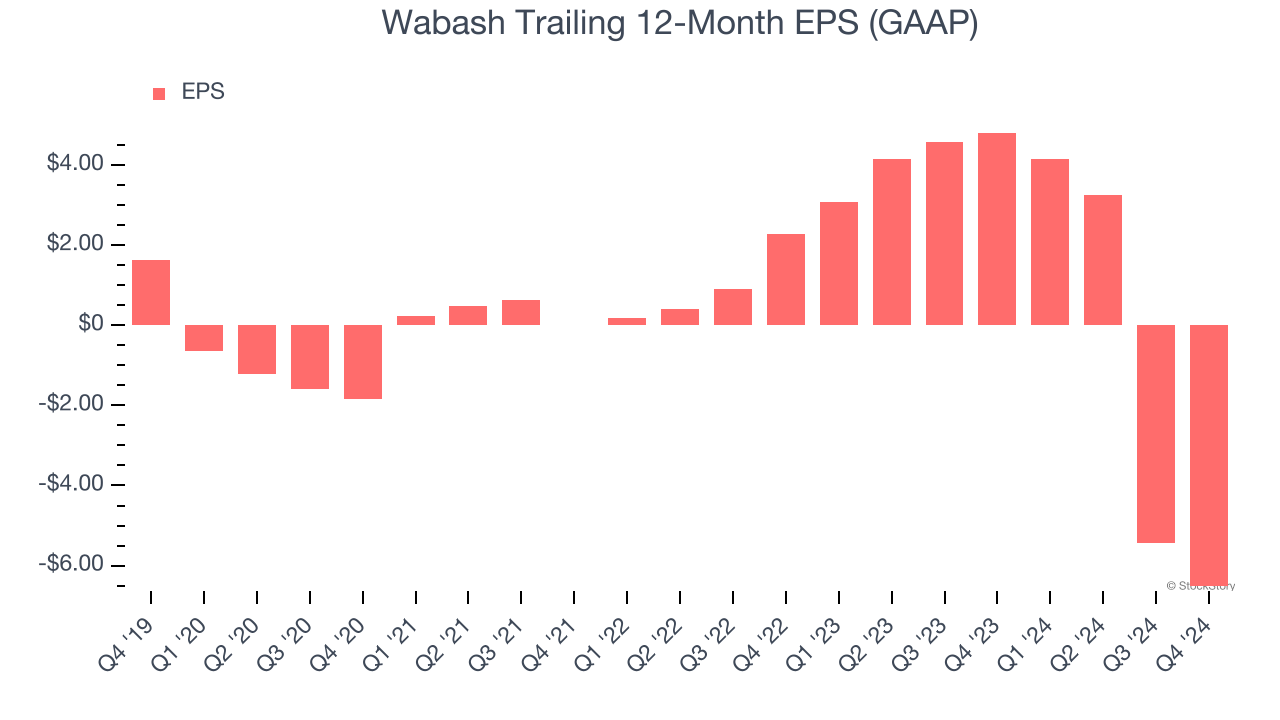
Earnings Per Share
Revenue trends explain a company’s historical growth, but the long-term change in earnings per share (EPS) points to the profitability of that growth – for example, a company could inflate its sales through excessive spending on advertising and promotions.
Sadly for Wabash, its EPS declined by more than its revenue over the last five years, dropping 43.2% annually. This tells us the company struggled because its fixed cost base made it difficult to adjust to shrinking demand.
Diving into the nuances of Wabash’s earnings can give us a better understanding of its performance. As we mentioned earlier, Wabash’s operating margin declined by 12.5 percentage points over the last five years. This was the most relevant factor (aside from the revenue impact) behind its lower earnings; taxes and interest expenses can also affect EPS but don’t tell us as much about a company’s fundamentals.
Like with revenue, we analyze EPS over a more recent period because it can provide insight into an emerging theme or development for the business.
For Wabash, its two-year annual EPS declines of 121% show it’s continued to underperform. These results were bad no matter how you slice the data.
In Q4, Wabash reported EPS at negative $0.02, down from $1.07 in the same quarter last year. This print missed analysts’ estimates. Over the next 12 months, Wall Street is optimistic. Analysts forecast Wabash’s full-year EPS of negative $6.52 will flip to positive $1.24.
Key Takeaways from Wabash’s Q4 Results
We were impressed by Wabash’s optimistic full-year revenue guidance, which beat analysts’ expectations. We were also happy its revenue narrowly outperformed Wall Street’s estimates. On the other hand, its full-year EPS guidance missed and its EBITDA fell short of Wall Street’s estimates. Overall, this quarter could have been better. The stock remained flat at $15.66 immediately after reporting.
Should you buy the stock or not? The latest quarter does matter, but not nearly as much as longer-term fundamentals and valuation, when deciding if the stock is a buy. We cover that in our actionable full research report which you can read here, it’s free.