Over the past six months, Inter Parfums has been a great trade, beating the S&P 500 by 6.3%. Its stock price has climbed to $128.70, representing a healthy 12.6% increase. This was partly due to its solid quarterly results, and the performance may have investors wondering how to approach the situation.
Is now still a good time to buy IPAR? Or is this a case of a company fueled by heightened investor enthusiasm? Find out in our full research report, it’s free.
Why Are We Positive On Inter Parfums?
With licenses to produce colognes and perfumes under brands such as Kate Spade, Van Cleef & Arpels, and Abercrombie & Fitch, Inter Parfums (NASDAQ: IPAR) manufactures and distributes fragrances worldwide.
1. Skyrocketing Revenue Shows Strong Momentum
Examining a company’s long-term performance can provide clues about its quality. Any business can put up a good quarter or two, but the best consistently grow over the long haul. Luckily, Inter Parfums’s sales grew at an impressive 18.5% compounded annual growth rate over the last three years. Its growth beat the average consumer staples company and shows its offerings resonate with customers. 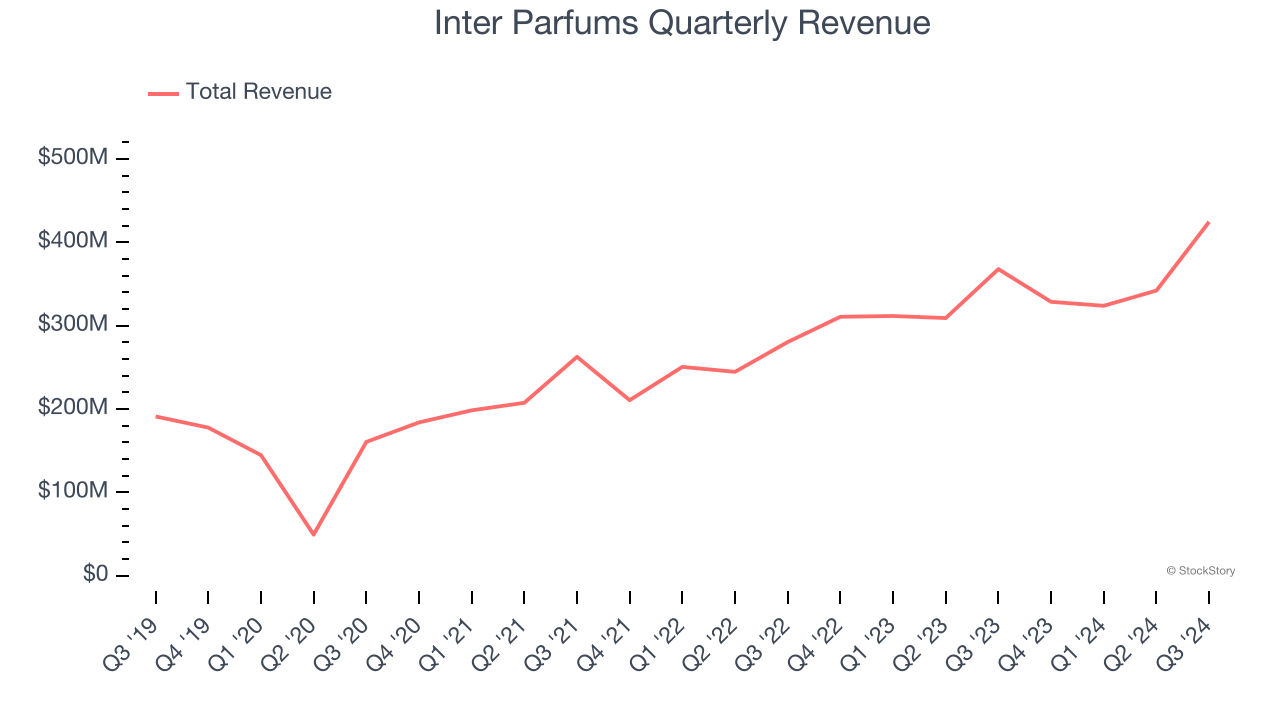
2. Elite Gross Margin Powers Best-In-Class Business Model
At StockStory, we prefer high gross margin businesses because they indicate pricing power or differentiated products, giving the company a chance to generate higher operating profits.
Inter Parfums has best-in-class unit economics for a consumer staples company, enabling it to invest in areas such as marketing and talent. As you can see below, it averaged an elite 58.9% gross margin over the last two years. That means for every $100 in revenue, only $41.12 went towards paying for raw materials, production of goods, transportation, and distribution. 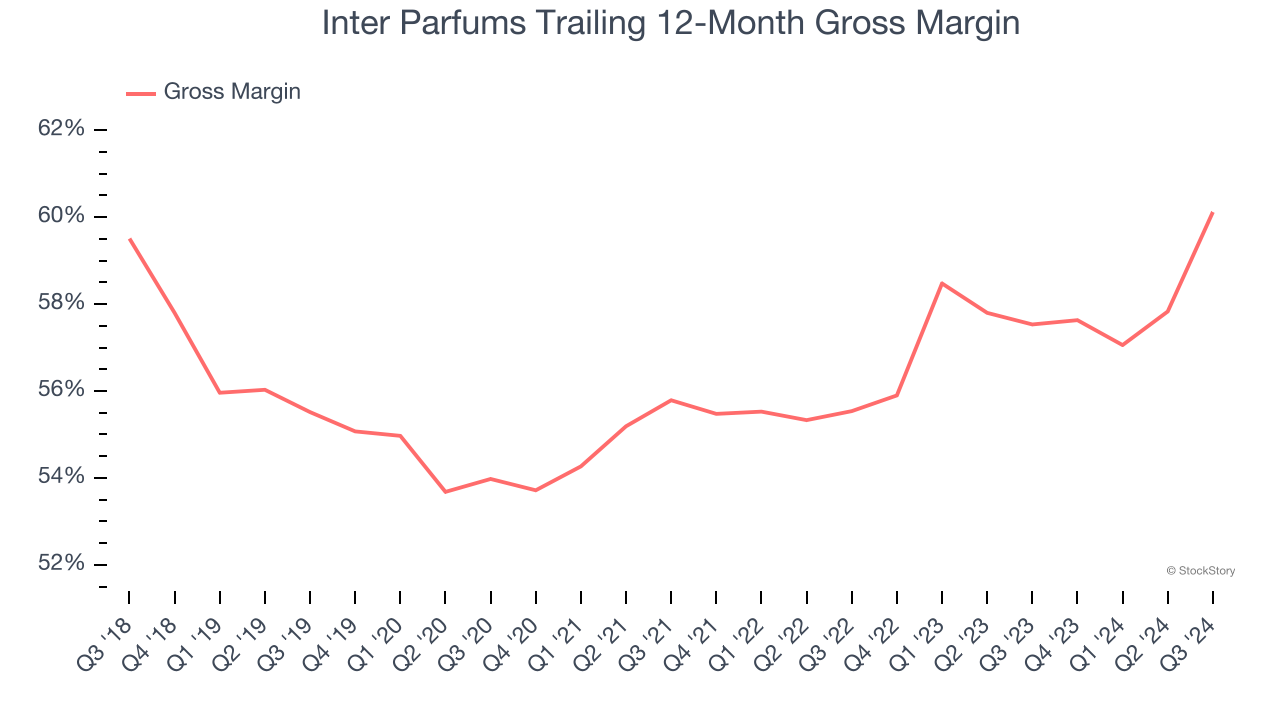
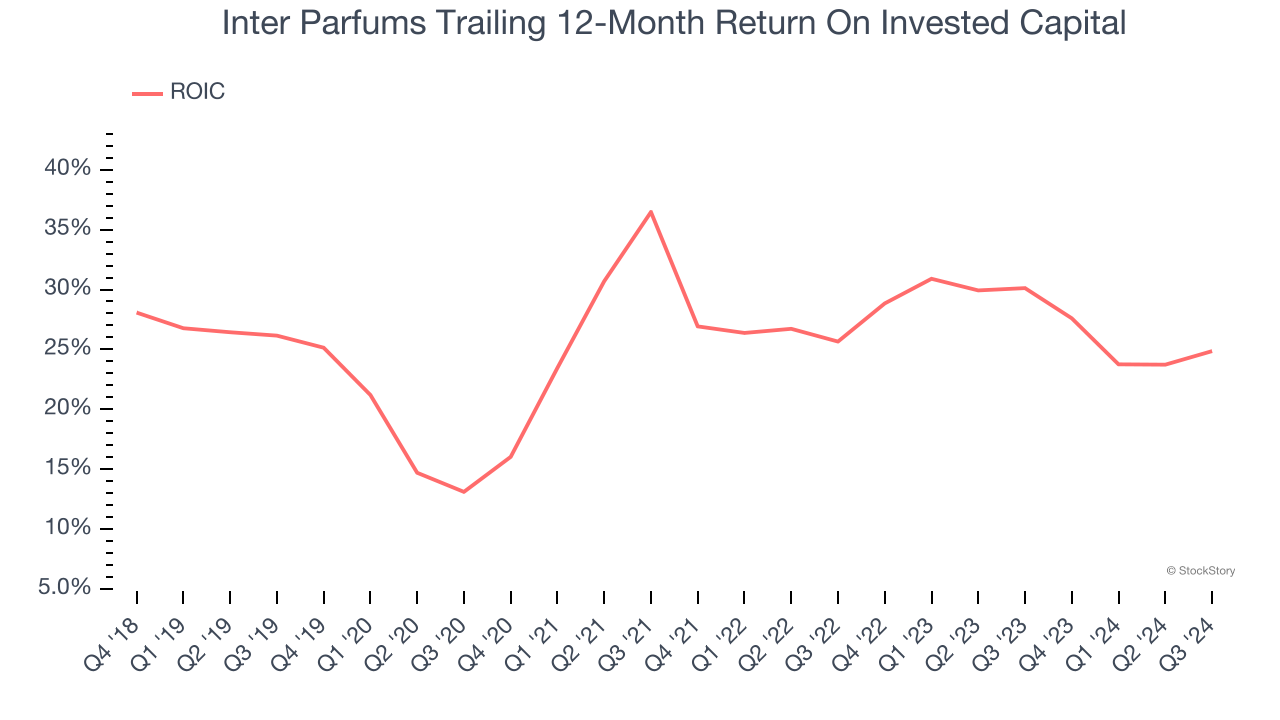
3. Stellar ROIC Showcases Lucrative Growth Opportunities
Growth gives us insight into a company’s long-term potential, but how capital-efficient was that growth? A company’s ROIC explains this by showing how much operating profit it makes compared to the money it has raised (debt and equity).
Inter Parfums’s five-year average ROIC was 26%, placing it among the best consumer staples companies. This illustrates its management team’s ability to invest in highly profitable ventures and produce tangible results for shareholders.
Final Judgment
These are just a few reasons why we're bullish on Inter Parfums, and with its shares beating the market recently, the stock trades at 22.9× forward price-to-earnings (or $128.70 per share). Is now a good time to initiate a position? See for yourself in our in-depth research report, it’s free.
Stocks We Like Even More Than Inter Parfums
With rates dropping, inflation stabilizing, and the elections in the rearview mirror, all signs point to the start of a new bull run - and we’re laser-focused on finding the best stocks for this upcoming cycle.
Put yourself in the driver’s seat by checking out our Top 9 Market-Beating Stocks. This is a curated list of our High Quality stocks that have generated a market-beating return of 175% over the last five years.
Stocks that made our list in 2019 include now familiar names such as Nvidia (+2,691% between September 2019 and September 2024) as well as under-the-radar businesses like United Rentals (+550% five-year return). Find your next big winner with StockStory today for free.