
Earnings results often indicate what direction a company will take in the months ahead. With Q3 behind us, let’s have a look at Sinclair (NASDAQ: SBGI) and its peers.
Broadcasting companies have been facing secular headwinds in the form of consumers abandoning traditional television and radio in favor of streaming services. As a result, many broadcasting companies have evolved by forming distribution agreements with major streaming platforms so they can get in on part of the action, but will these subscription revenues be as high quality and high margin as their legacy revenues? Only time will tell which of these broadcasters will survive the sea changes of technological advancement and fragmenting consumer attention.
The 9 broadcasting stocks we track reported a satisfactory Q3. As a group, revenues beat analysts’ consensus estimates by 0.8% while next quarter’s revenue guidance was 9.5% below.
While some broadcasting stocks have fared somewhat better than others, they have collectively declined. On average, share prices are down 2.6% since the latest earnings results.
Sinclair (NASDAQ: SBGI)
Founded in 1971, Sinclair (NASDAQ: SBGI) is an American media company operating numerous television stations and providing multi-platform broadcasting services.
Sinclair reported revenues of $917 million, up 19.6% year on year. This print fell short of analysts’ expectations by 0.8%, but it was still a satisfactory quarter for the company with a solid beat of analysts’ EPS estimates but revenue guidance for next quarter missing analysts’ expectations.
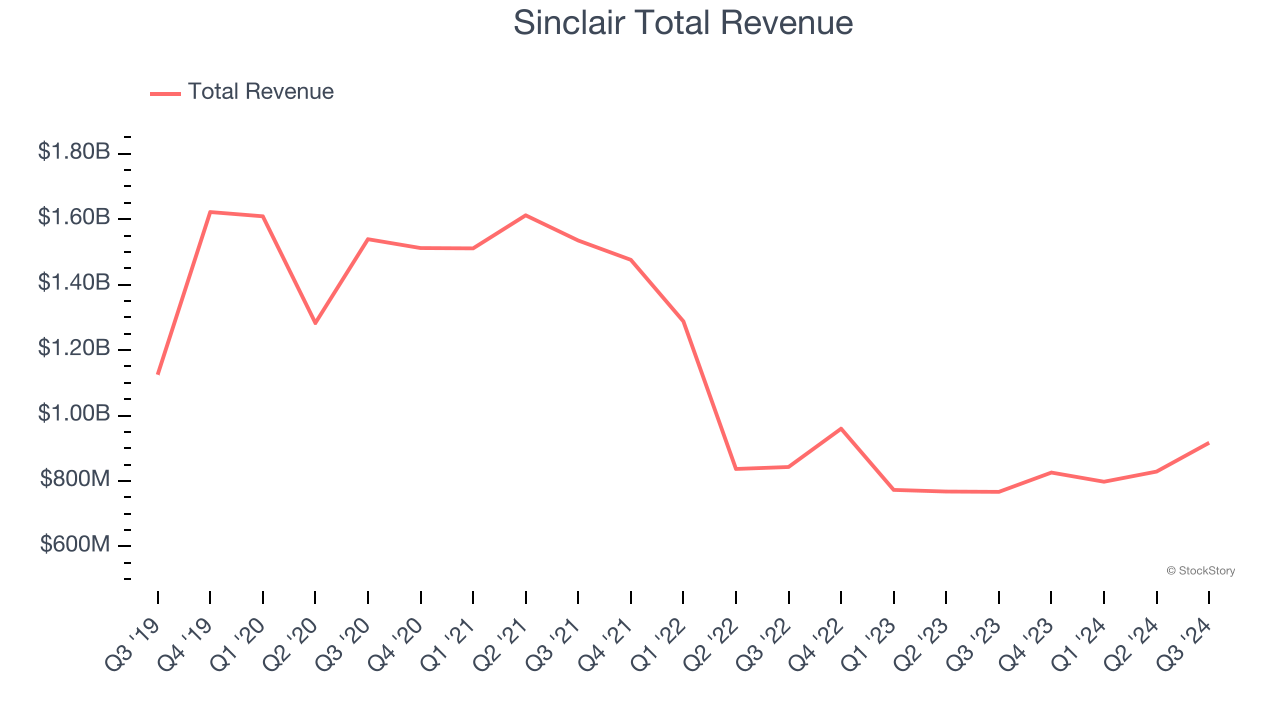
The market was likely pricing in the results, and the stock is flat since reporting. It currently trades at $17.30.
Is now the time to buy Sinclair? Access our full analysis of the earnings results here, it’s free.
Best Q3: AMC Networks (NASDAQ: AMCX)
Originally the joint-venture of four cable television companies, AMC Networks (NASDAQ: AMCX) is a broadcaster producing a diverse range of television shows and movies.
AMC Networks reported revenues of $599.6 million, down 5.9% year on year, outperforming analysts’ expectations by 2.1%. The business had a stunning quarter with a solid beat of analysts’ EPS estimates and an impressive beat of analysts’ EBITDA estimates.
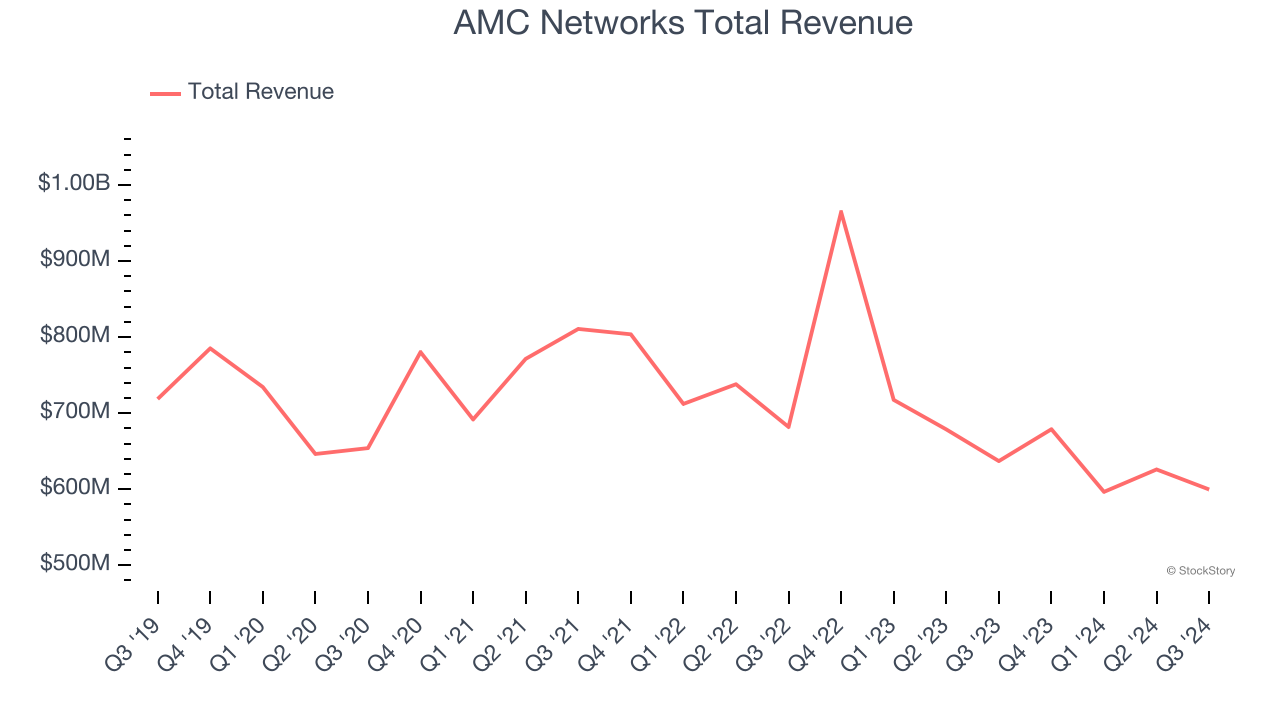
The market seems happy with the results as the stock is up 15.2% since reporting. It currently trades at $9.63.
Is now the time to buy AMC Networks? Access our full analysis of the earnings results here, it’s free.
Weakest Q3: Gray Television (NYSE: GTN)
Specializing in local media coverage, Gray Television (NYSE: GTN) is a broadcast company supplying digital media to various markets in the United States.
Gray Television reported revenues of $950 million, up 18.3% year on year, falling short of analysts’ expectations by 1.8%. It was a softer quarter as it posted revenue guidance for next quarter missing analysts’ expectations significantly and a miss of analysts’ EPS estimates.
As expected, the stock is down 38.7% since the results and currently trades at $3.55.
Read our full analysis of Gray Television’s results here.
E.W. Scripps (NASDAQ: SSP)
Founded as a chain of daily newspapers, E.W. Scripps (NASDAQ: SSP) is a diversified media enterprise operating a range of local television stations, national networks, and digital media platforms.
E.W. Scripps reported revenues of $646.3 million, up 14.1% year on year. This print surpassed analysts’ expectations by 2.7%. Taking a step back, it was a mixed quarter as it also recorded a solid beat of analysts’ EBITDA estimates but a significant miss of analysts’ EPS estimates.
The stock is down 26.1% since reporting and currently trades at $2.61.
Read our full, actionable report on E.W. Scripps here, it’s free.
Paramount (NASDAQ: PARA)
Owner of Spongebob Squarepants and formerly known as ViacomCBS, Paramount Global (NASDAQ: PARA) is a major media conglomerate offering television, film production, and digital content across various global platforms.
Paramount reported revenues of $6.73 billion, down 5.6% year on year. This number lagged analysts' expectations by 3.4%. In spite of that, it was a very strong quarter as it produced an impressive beat of analysts’ EPS estimates.
Paramount had the weakest performance against analyst estimates among its peers. The stock is down 8% since reporting and currently trades at $10.63.
Read our full, actionable report on Paramount here, it’s free.
Market Update
Thanks to the Fed's series of rate hikes in 2022 and 2023, inflation has cooled significantly from its post-pandemic highs, drawing closer to the 2% goal. This disinflation has occurred without severely impacting economic growth, suggesting the success of a soft landing. The stock market has thrived in 2024, spurred by recent rate cuts (0.5% in September and 0.25% each in November and December), and a notable surge followed Donald Trump's presidential election win in November, propelling indices to historic highs. Nonetheless, the outlook for 2025 remains clouded by the pace and magnitude of future rate cuts as well as potential changes in trade policy and corporate taxes once the Trump administration takes over. The path forward is marked by uncertainty.
Want to invest in winners with rock-solid fundamentals? Check out our Hidden Gem Stocks and add them to your watchlist. These companies are poised for growth regardless of the political or macroeconomic climate.
Join Paid Stock Investor Research
Help us make StockStory more helpful to investors like yourself. Join our paid user research session and receive a $50 Amazon gift card for your opinions. Sign up here.


