ETFOptimize | High-performance ETF-based Investment Strategies

Quantitative strategies, Wall Street-caliber research, and insightful market analysis since 1998.


ETFOptimize | HOME
Close Window

Artisan Partners (APAM): Buy, Sell, or Hold Post Q2 Earnings?

APAM Cover Image

Artisan Partners trades at $43.40 and has moved in lockstep with the market. Its shares have returned 21.6% over the last six months while the S&P 500 has gained 22.9%.

Is now the time to buy Artisan Partners, or should you be careful about including it in your portfolio? Get the full stock story straight from our expert analysts, it’s free for active Edge members.

Why Is Artisan Partners Not Exciting?

We don't have much confidence in Artisan Partners. Here are two reasons we avoid APAM and a stock we'd rather own.

1. Long-Term Revenue Growth Disappoints

A company’s long-term performance is an indicator of its overall quality. Even a bad business can shine for one or two quarters, but a top-tier one grows for years.

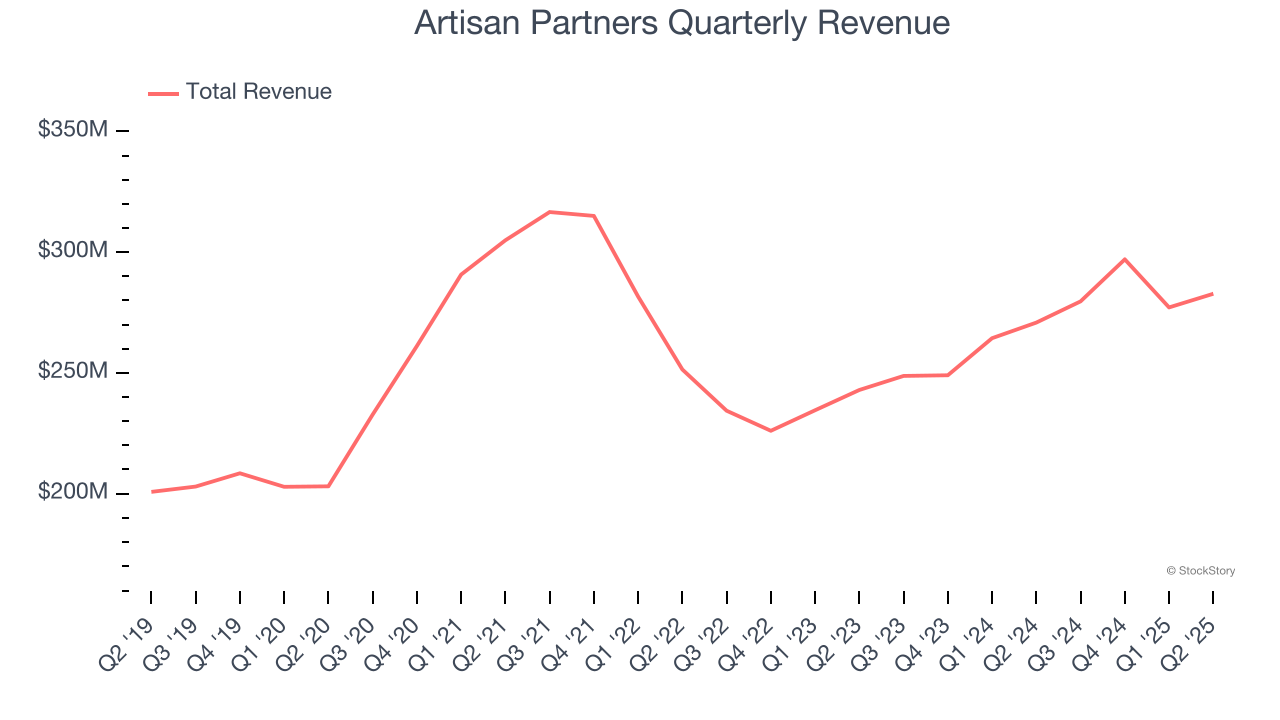
Over the last five years, Artisan Partners grew its revenue at a mediocre 6.8% compounded annual growth rate. This fell short of our benchmark for the financials sector.

Artisan Partners Quarterly Revenue

2. EPS Barely Growing

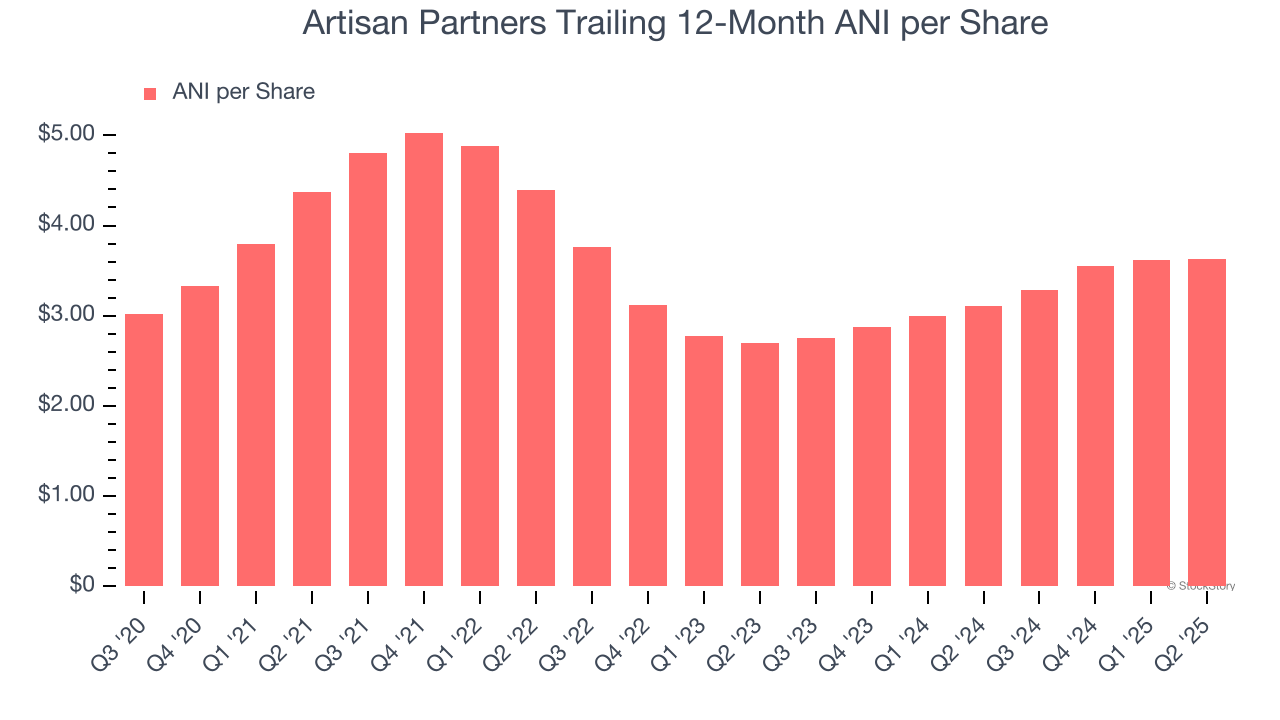
Analyzing the long-term change in earnings per share (EPS) shows whether a company's incremental sales were profitable – for example, revenue could be inflated through excessive spending on advertising and promotions.

Artisan Partners’s unimpressive 5% annual EPS growth over the last five years aligns with its revenue performance. This tells us it maintained its per-share profitability as it expanded.

Artisan Partners Trailing 12-Month ANI per Share

Final Judgment

Artisan Partners’s business quality ultimately falls short of our standards. That said, the stock currently trades at 11.1× forward P/E (or $43.40 per share). While this valuation is reasonable, we don’t really see a big opportunity at the moment. We're fairly confident there are better investments elsewhere. We’d suggest looking at the most entrenched endpoint security platform on the market.

High-Quality Stocks for All Market Conditions

Trump’s April 2025 tariff bombshell triggered a massive market selloff, but stocks have since staged an impressive recovery, leaving those who panic sold on the sidelines.

Take advantage of the rebound by checking out our Top 6 Stocks for this week. This is a curated list of our High Quality stocks that have generated a market-beating return of 183% over the last five years (as of March 31st 2025).

Stocks that made our list in 2020 include now familiar names such as Nvidia (+1,545% between March 2020 and March 2025) as well as under-the-radar businesses like the once-micro-cap company Tecnoglass (+1,754% five-year return). Find your next big winner with StockStory today.

StockStory is growing and hiring equity analyst and marketing roles. Are you a 0 to 1 builder passionate about the markets and AI? See the open roles here.

Recent Quotes

View More
Symbol Price Change (%)
AMZN  244.41
+1.37 (0.56%)
AAPL  268.47
-1.30 (-0.48%)
AMD  233.54
-4.16 (-1.75%)
BAC  53.20
-0.09 (-0.17%)
GOOG  279.70
-5.64 (-1.98%)
META  621.71
+2.77 (0.45%)
MSFT  496.82
-0.28 (-0.06%)
NVDA  188.15
+0.07 (0.04%)
ORCL  239.26
-4.54 (-1.86%)
TSLA  429.52
-16.39 (-3.68%)
Stock Quote API & Stock News API supplied by www.cloudquote.io
Quotes delayed at least 20 minutes.
By accessing this page, you agree to the Privacy Policy and Terms Of Service.


IntelligentValue Home
Close Window

DISCLAIMER

All content herein is issued solely for informational purposes and is not to be construed as an offer to sell or the solicitation of an offer to buy, nor should it be interpreted as a recommendation to buy, hold or sell (short or otherwise) any security.  All opinions, analyses, and information included herein are based on sources believed to be reliable, but no representation or warranty of any kind, expressed or implied, is made including but not limited to any representation or warranty concerning accuracy, completeness, correctness, timeliness or appropriateness. We undertake no obligation to update such opinions, analysis or information. You should independently verify all information contained on this website. Some information is based on analysis of past performance or hypothetical performance results, which have inherent limitations. We make no representation that any particular equity or strategy will or is likely to achieve profits or losses similar to those shown. Shareholders, employees, writers, contractors, and affiliates associated with ETFOptimize.com may have ownership positions in the securities that are mentioned. If you are not sure if ETFs, algorithmic investing, or a particular investment is right for you, you are urged to consult with a Registered Investment Advisor (RIA). Neither this website nor anyone associated with producing its content are Registered Investment Advisors, and no attempt is made herein to substitute for personalized, professional investment advice. Neither ETFOptimize.com, Global Alpha Investments, Inc., nor its employees, service providers, associates, or affiliates are responsible for any investment losses you may incur as a result of using the information provided herein. Remember that past investment returns may not be indicative of future returns.

Copyright © 1998-2017 ETFOptimize.com, a publication of Optimized Investments, Inc. All rights reserved.