
Financial services giant Wells Fargo (NYSE: WFC) reported revenue ahead of Wall Street’s expectations in Q3 CY2025, with sales up 5.3% year on year to $21.44 billion. Its GAAP profit of $1.66 per share was 7.4% above analysts’ consensus estimates.
Is now the time to buy Wells Fargo? Find out by accessing our full research report, it’s free for active Edge members.
Wells Fargo (WFC) Q3 CY2025 Highlights:
- Net Interest Income: $11.95 billion vs analyst estimates of $12.08 billion (2.2% year-on-year growth, 1.1% miss)
- Net Interest Margin: 2.6% vs analyst estimates of 2.7% (9 basis point miss)
- Revenue: $21.44 billion vs analyst estimates of $21.13 billion (5.3% year-on-year growth, 1.5% beat)
- Efficiency Ratio: 65% vs analyst estimates of 63.7% (128.5 basis point miss)
- EPS (GAAP): $1.66 vs analyst estimates of $1.55 (7.4% beat)
- Tangible Book Value per Share: $44.18 vs analyst estimates of $43.69 (6% year-on-year growth, 1.1% beat)
- Market Capitalization: $252.8 billion
Company Overview
Founded during the California Gold Rush in 1852 to provide banking and express delivery services to miners and merchants, Wells Fargo (NYSE: WFC) is a diversified financial services company that provides banking, lending, investment, and wealth management services to individuals and businesses.
Sales Growth
In general, banks make money from two primary sources. The first is net interest income, which is interest earned on loans, mortgages, and investments in securities minus interest paid out on deposits. The second source is non-interest income, which can come from bank account, credit card, wealth management, investing banking, and trading fees. Unfortunately, Wells Fargo’s 1.8% annualized revenue growth over the last five years was tepid. This fell short of our benchmarks and is a tough starting point for our analysis.
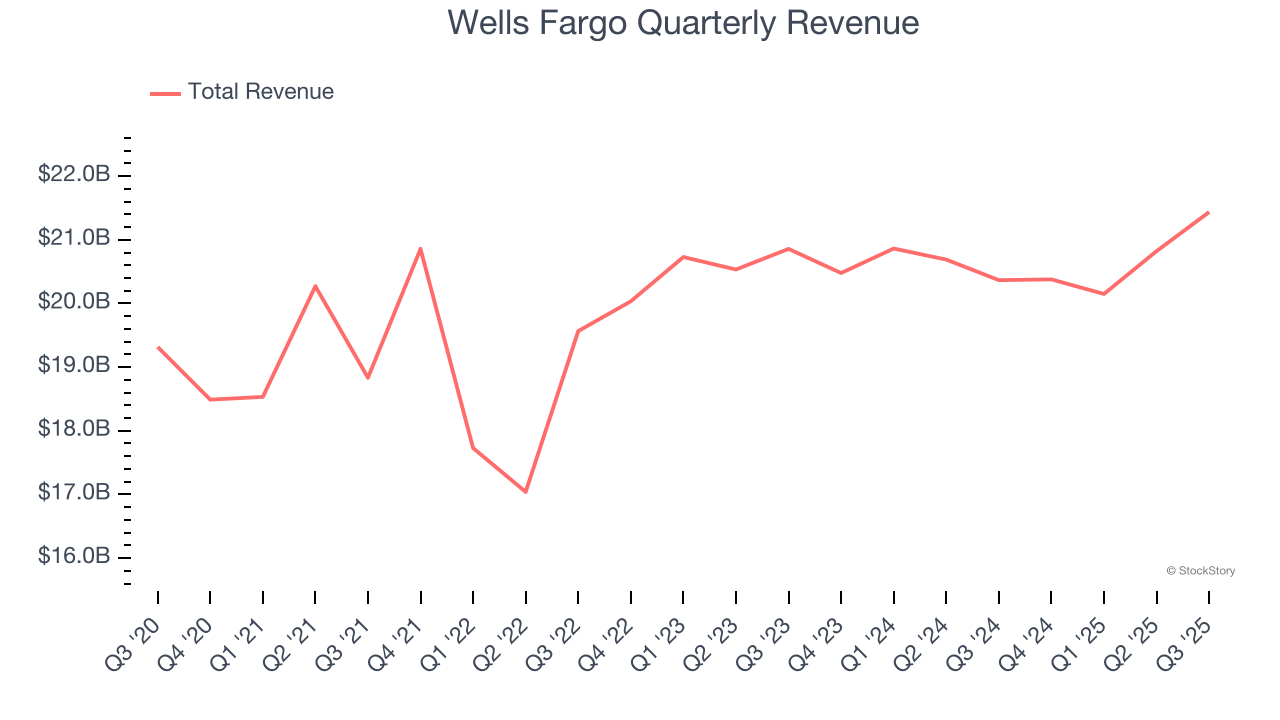
We at StockStory place the most emphasis on long-term growth, but within financials, a half-decade historical view may miss recent interest rate changes, market returns, and industry trends. Wells Fargo’s recent performance shows its demand has slowed as its revenue was flat over the last two years. 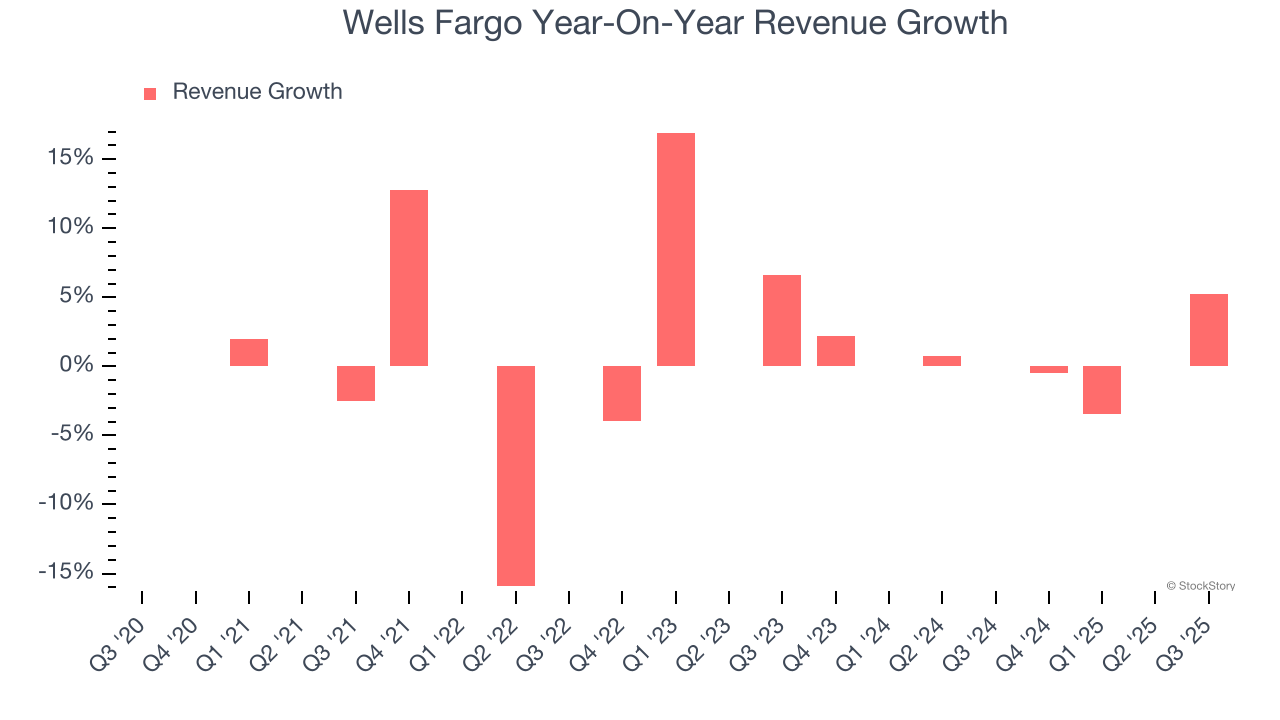 Note: Quarters not shown were determined to be outliers, impacted by outsized investment gains/losses that are not indicative of the recurring fundamentals of the business.
This quarter, Wells Fargo reported year-on-year revenue growth of 5.3%, and its $21.44 billion of revenue exceeded Wall Street’s estimates by 1.5%.
Net interest income made up 56.4% of the company’s total revenue during the last five years, meaning Wells Fargo’s growth drivers strike a balance between lending and non-lending activities.
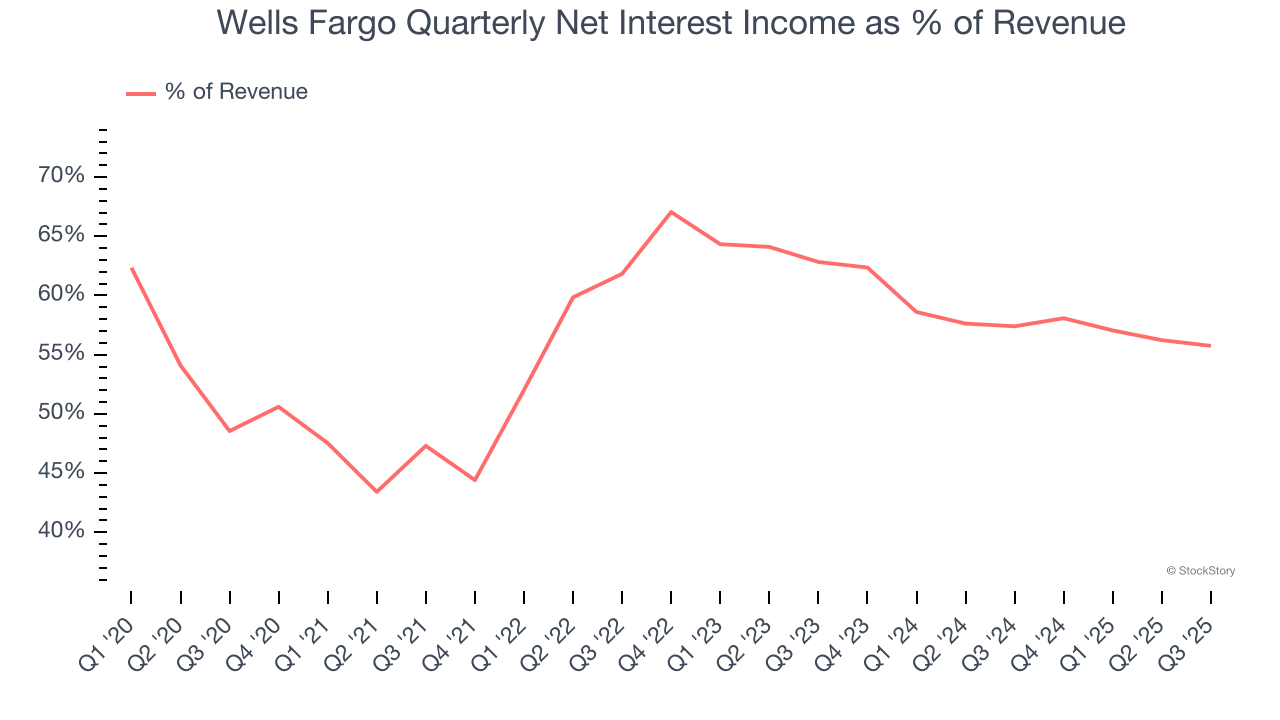
Net interest income commands greater market attention due to its reliability and consistency, whereas non-interest income is often seen as lower-quality revenue that lacks the same dependable characteristics.
Here at StockStory, we certainly understand the potential of thematic investing. Diverse winners from Microsoft (MSFT) to Alphabet (GOOG), Coca-Cola (KO) to Monster Beverage (MNST) could all have been identified as promising growth stories with a megatrend driving the growth. So, in that spirit, we’ve identified a relatively under-the-radar profitable growth stock benefiting from the rise of AI, available to you FREE via this link.
Tangible Book Value Per Share (TBVPS)
Banks profit by intermediating between depositors and borrowers, making them fundamentally balance sheet-driven enterprises. Market participants emphasize balance sheet quality and sustained book value growth when evaluating these institutions.
Because of this, tangible book value per share (TBVPS) emerges as the critical performance benchmark. By excluding intangible assets with uncertain liquidation values, this metric captures real, liquid net worth per share. Traditional metrics like EPS are helpful but face distortion from M&A activity and loan loss accounting rules.
Wells Fargo’s TBVPS grew at a solid 6.3% annual clip over the last five years. TBVPS growth has also accelerated recently, growing by 8.6% annually over the last two years from $37.49 to $44.18 per share.
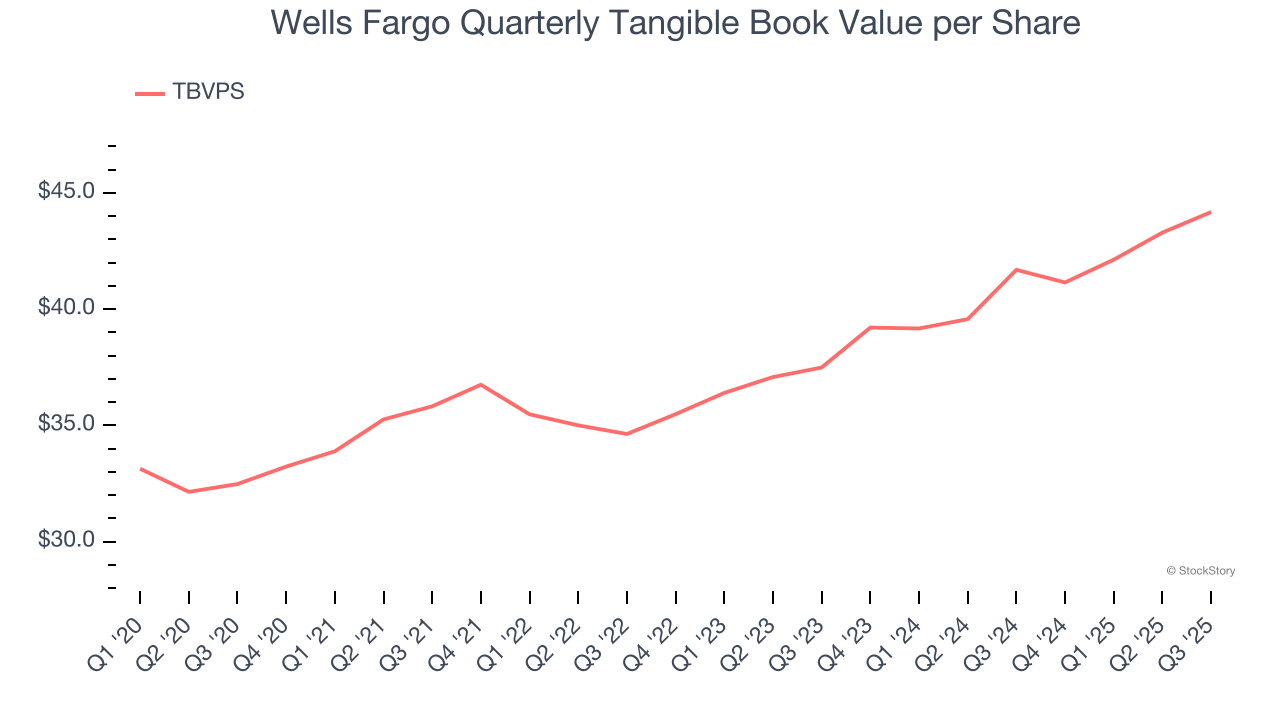
Over the next 12 months, Consensus estimates call for Wells Fargo’s TBVPS to grow by 4% to $45.94, paltry growth rate.
Key Takeaways from Wells Fargo’s Q3 Results
It was good to see Wells Fargo narrowly top analysts’ revenue expectations this quarter, leading to an EPS beat. We were also happy its tangible book value per share narrowly outperformed Wall Street’s estimates. On the other hand, its net interest income slightly missed. Zooming out, we think this was a decent quarter. The stock traded up 2.9% to $81.20 immediately following the results.
Is Wells Fargo an attractive investment opportunity at the current price? We think that the latest quarter is only one piece of the longer-term business quality puzzle. Quality, when combined with valuation, can help determine if the stock is a buy. We cover that in our actionable full research report which you can read here, it’s free for active Edge members.