
Over the past six months, Jacobs Solutions has been a great trade, beating the S&P 500 by 11.3%. Its stock price has climbed to $158, representing a healthy 34.5% increase. This was partly due to its solid quarterly results, and the performance may have investors wondering how to approach the situation.
Is there a buying opportunity in Jacobs Solutions, or does it present a risk to your portfolio? Dive into our full research report to see our analyst team’s opinion, it’s free for active Edge members.
Why Do We Think Jacobs Solutions Will Underperform?
We’re glad investors have benefited from the price increase, but we're swiping left on Jacobs Solutions for now. Here are three reasons we avoid J and a stock we'd rather own.
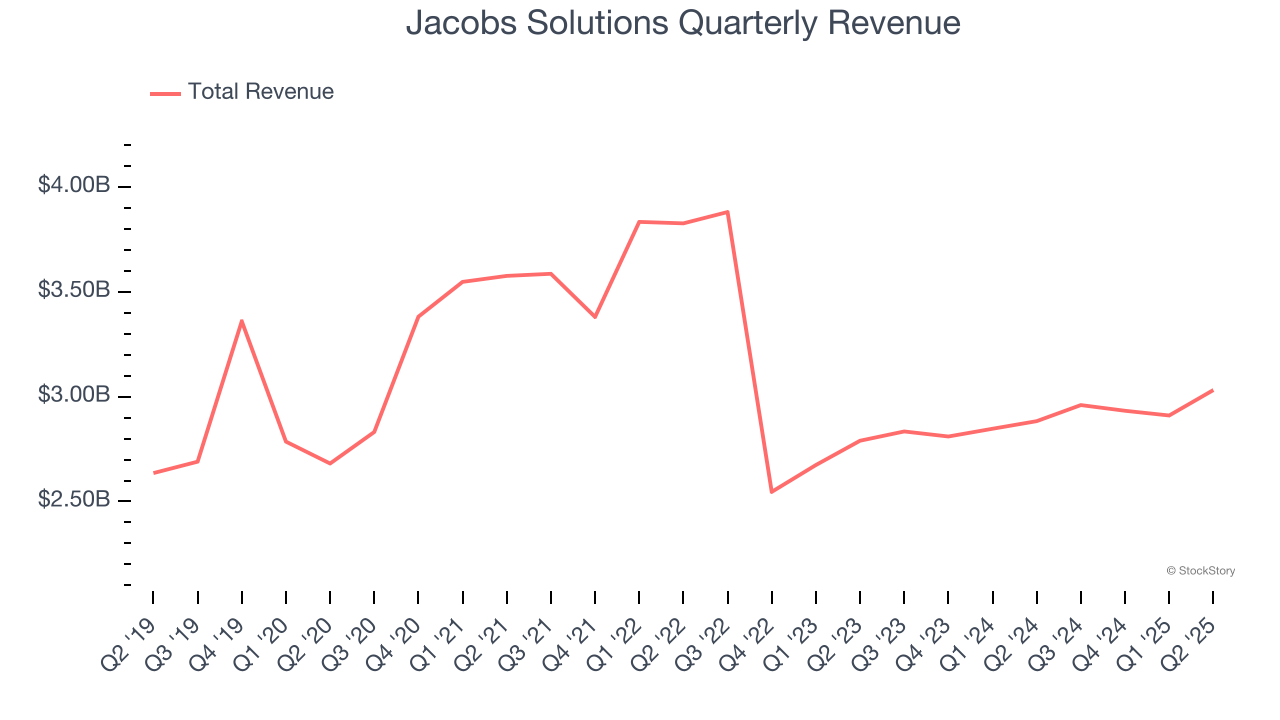
1. Long-Term Revenue Growth Flatter Than a Pancake
A company’s long-term sales performance can indicate its overall quality. Even a bad business can shine for one or two quarters, but a top-tier one grows for years. Unfortunately, Jacobs Solutions struggled to consistently increase demand as its $11.84 billion of sales for the trailing 12 months was close to its revenue five years ago. This was below our standards and is a sign of poor business quality.
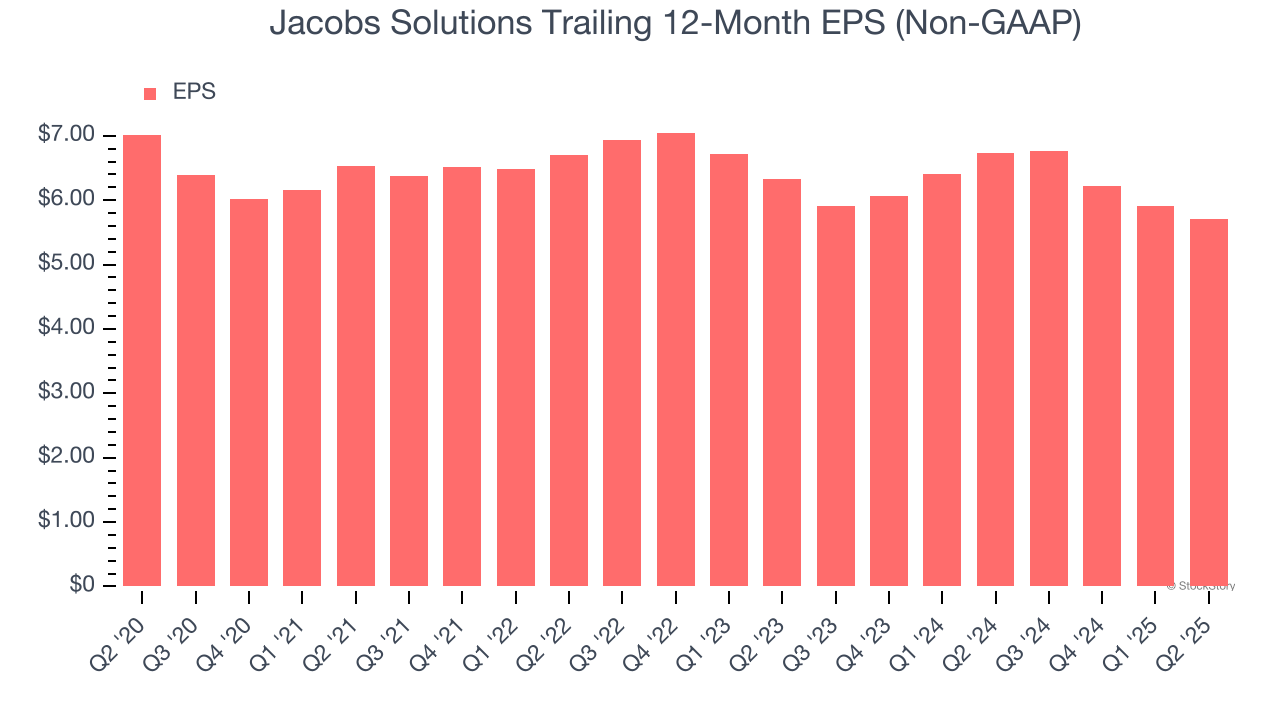
2. EPS Trending Down
Analyzing the long-term change in earnings per share (EPS) shows whether a company's incremental sales were profitable – for example, revenue could be inflated through excessive spending on advertising and promotions.
Sadly for Jacobs Solutions, its EPS declined by 4% annually over the last five years while its revenue was flat. This tells us the company struggled because its fixed cost base made it difficult to adjust to choppy demand.
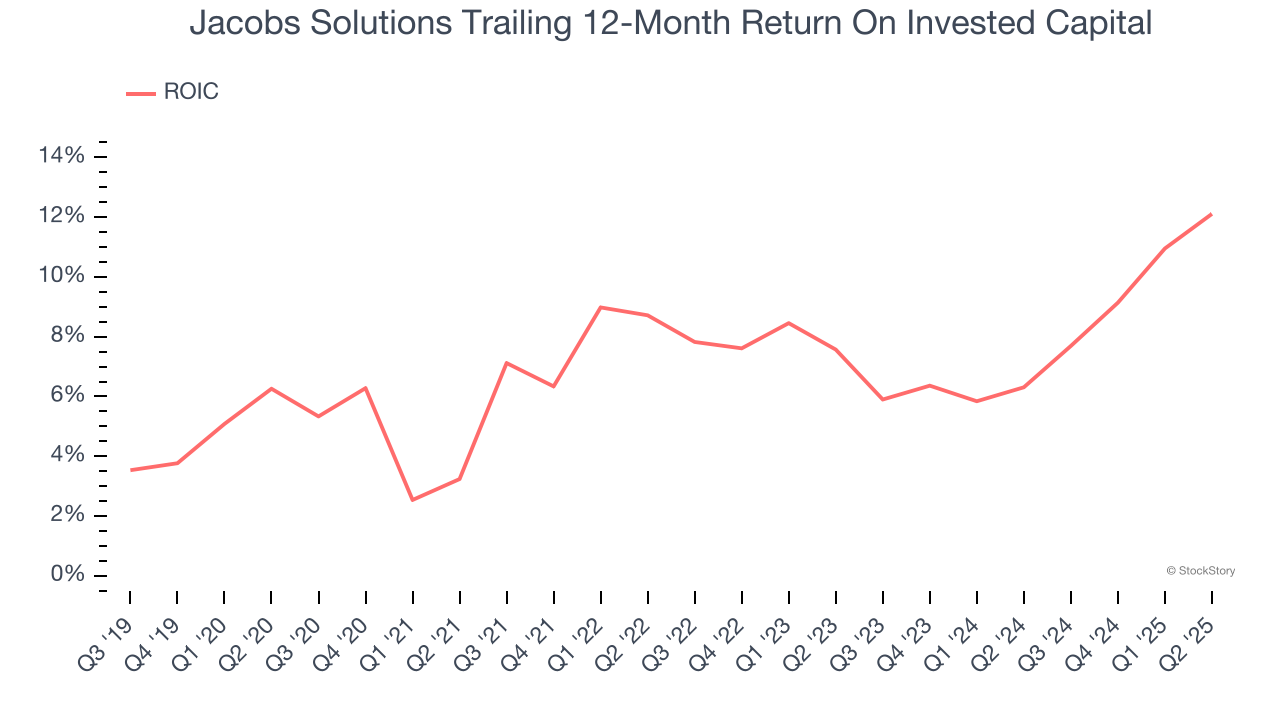
3. Previous Growth Initiatives Haven’t Impressed
Growth gives us insight into a company’s long-term potential, but how capital-efficient was that growth? A company’s ROIC explains this by showing how much operating profit it makes compared to the money it has raised (debt and equity).
Jacobs Solutions historically did a mediocre job investing in profitable growth initiatives. Its five-year average ROIC was 7.6%, somewhat low compared to the best business services companies that consistently pump out 25%+.
Final Judgment
We cheer for all companies making their customers lives easier, but in the case of Jacobs Solutions, we’ll be cheering from the sidelines. With its shares beating the market recently, the stock trades at 23.1× forward P/E (or $158 per share). This valuation tells us a lot of optimism is priced in - we think there are better stocks to buy right now. We’d suggest looking at a fast-growing restaurant franchise with an A+ ranch dressing sauce.
High-Quality Stocks for All Market Conditions
When Trump unveiled his aggressive tariff plan in April 2025, markets tanked as investors feared a full-blown trade war. But those who panicked and sold missed the subsequent rebound that’s already erased most losses.
Don’t let fear keep you from great opportunities and take a look at Top 9 Market-Beating Stocks. This is a curated list of our High Quality stocks that have generated a market-beating return of 183% over the last five years (as of March 31st 2025).
Stocks that made our list in 2020 include now familiar names such as Nvidia (+1,545% between March 2020 and March 2025) as well as under-the-radar businesses like the once-micro-cap company Kadant (+351% five-year return). Find your next big winner with StockStory today.
StockStory is growing and hiring equity analyst and marketing roles. Are you a 0 to 1 builder passionate about the markets and AI? See the open roles here.