
What a fantastic six months it’s been for Artivion. Shares of the company have skyrocketed 78.2%, hitting $41.02. This was partly thanks to its solid quarterly results, and the performance may have investors wondering how to approach the situation.
Is there a buying opportunity in Artivion, or does it present a risk to your portfolio? See what our analysts have to say in our full research report, it’s free for active Edge members.
Why Is Artivion Not Exciting?
Despite the momentum, we're sitting this one out for now. Here are three reasons you should be careful with AORT and a stock we'd rather own.
1. Fewer Distribution Channels Limit its Ceiling
Larger companies benefit from economies of scale, where fixed costs like infrastructure, technology, and administration are spread over a higher volume of goods or services, reducing the cost per unit. Scale can also lead to bargaining power with suppliers, greater brand recognition, and more investment firepower. A virtuous cycle can ensue if a scaled company plays its cards right.
With just $405 million in revenue over the past 12 months, Artivion is a small company in an industry where scale matters. This makes it difficult to build trust with customers because healthcare is heavily regulated, complex, and resource-intensive.
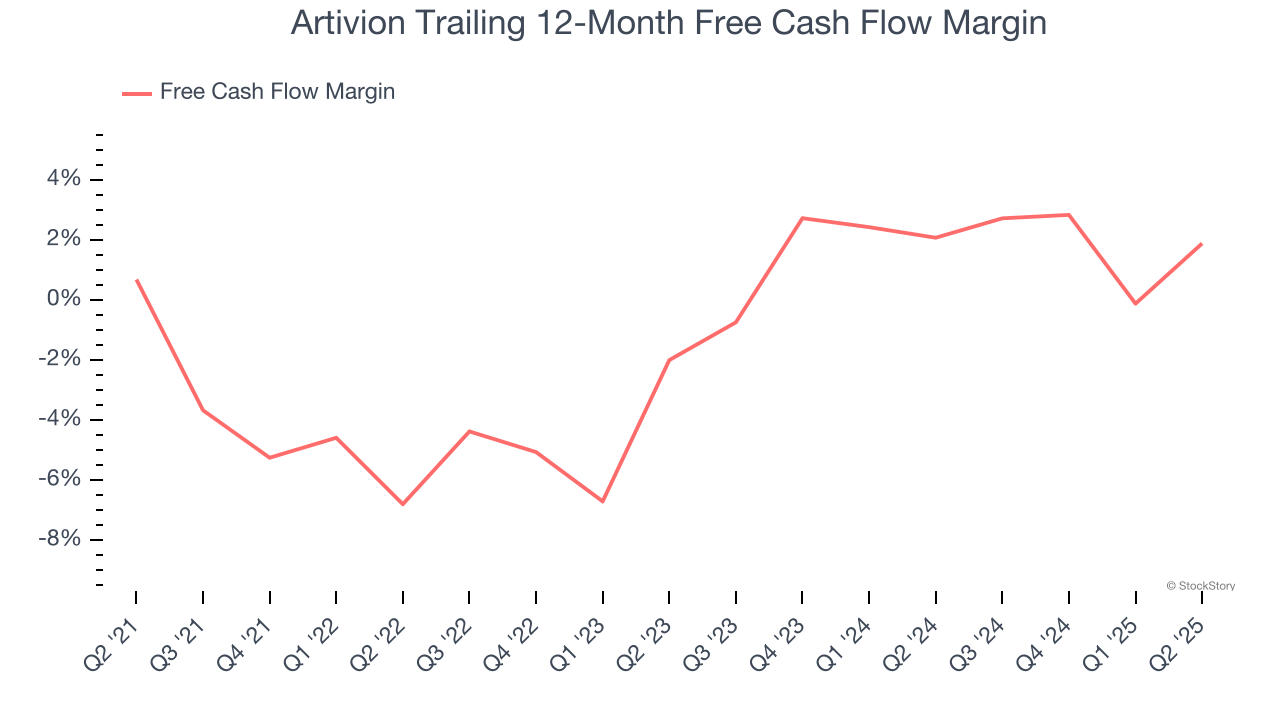
2. Breakeven Free Cash Flow Limits Reinvestment Potential
Free cash flow isn't a prominently featured metric in company financials and earnings releases, but we think it's telling because it accounts for all operating and capital expenses, making it tough to manipulate. Cash is king.
Artivion broke even from a free cash flow perspective over the last five years, giving the company limited opportunities to return capital to shareholders.
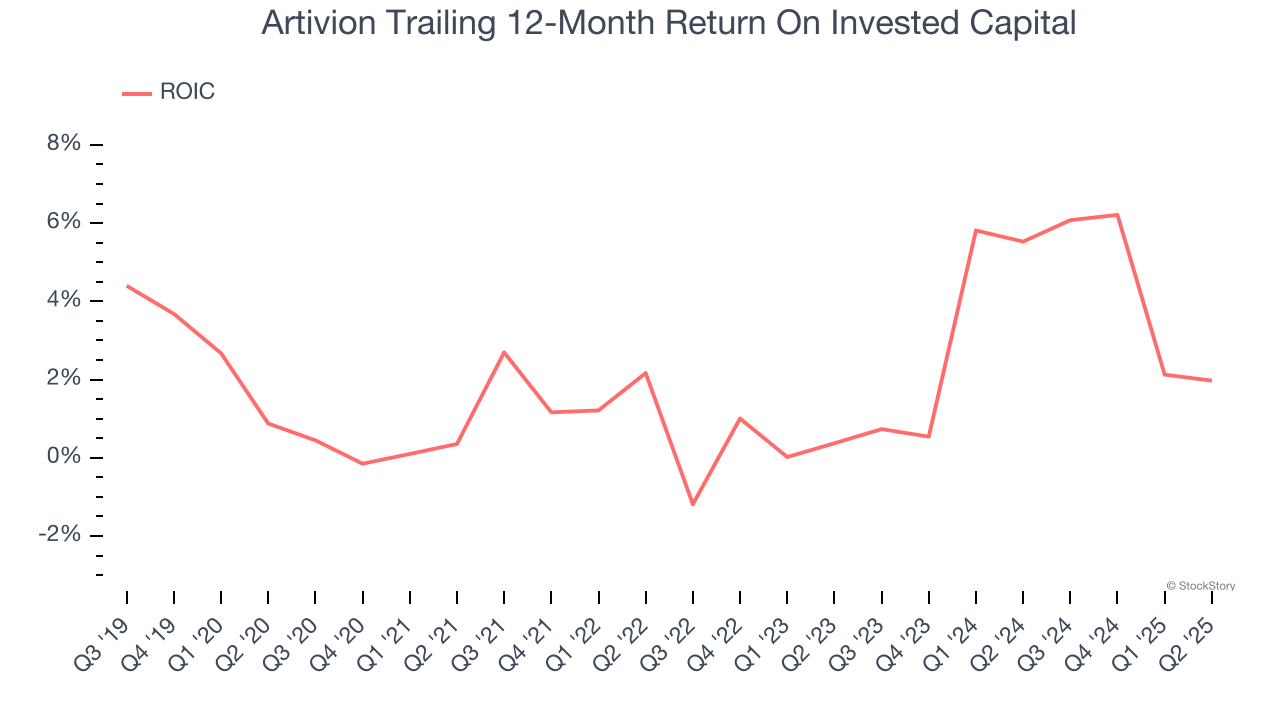
3. Previous Growth Initiatives Haven’t Impressed
Growth gives us insight into a company’s long-term potential, but how capital-efficient was that growth? A company’s ROIC explains this by showing how much operating profit it makes compared to the money it has raised (debt and equity).
Artivion historically did a mediocre job investing in profitable growth initiatives. Its five-year average ROIC was 2.1%, lower than the typical cost of capital (how much it costs to raise money) for healthcare companies.
Final Judgment
Artivion’s business quality ultimately falls short of our standards. Following the recent surge, the stock trades at 59.1× forward P/E (or $41.02 per share). This multiple tells us a lot of good news is priced in - we think other companies feature superior fundamentals at the moment. Let us point you toward an all-weather company that owns household favorite Taco Bell.
Stocks We Like More Than Artivion
When Trump unveiled his aggressive tariff plan in April 2025, markets tanked as investors feared a full-blown trade war. But those who panicked and sold missed the subsequent rebound that’s already erased most losses.
Don’t let fear keep you from great opportunities and take a look at Top 5 Strong Momentum Stocks for this week. This is a curated list of our High Quality stocks that have generated a market-beating return of 183% over the last five years (as of March 31st 2025).
Stocks that made our list in 2020 include now familiar names such as Nvidia (+1,545% between March 2020 and March 2025) as well as under-the-radar businesses like the once-small-cap company Comfort Systems (+782% five-year return). Find your next big winner with StockStory today.
StockStory is growing and hiring equity analyst and marketing roles. Are you a 0 to 1 builder passionate about the markets and AI? See the open roles here.


