
Regional banking company First Horizon (NYSE: FHN) announced better-than-expected revenue in Q3 CY2025, with sales up 7.5% year on year to $889 million. Its non-GAAP profit of $0.51 per share was 14.6% above analysts’ consensus estimates.
Is now the time to buy First Horizon? Find out by accessing our full research report, it’s free for active Edge members.
First Horizon (FHN) Q3 CY2025 Highlights:
- Net Interest Income: $674 million vs analyst estimates of $655.6 million (7.5% year-on-year growth, 2.8% beat)
- Net Interest Margin: 3.6% vs analyst estimates of 3.4% (14.2 basis point beat)
- Revenue: $889 million vs analyst estimates of $841.9 million (7.5% year-on-year growth, 5.6% beat)
- Efficiency Ratio: 61.9% vs analyst estimates of 59.3% (258.3 basis point miss)
- Adjusted EPS: $0.51 vs analyst estimates of $0.45 (14.6% beat)
- Tangible Book Value per Share: $13.94 vs analyst estimates of $13.78 (7% year-on-year growth, 1.2% beat)
- Market Capitalization: $11.69 billion
Company Overview
Tracing its roots back to 1864 during the Civil War era, First Horizon (NYSE: FHN) is a Tennessee-based bank holding company that provides commercial and consumer banking, wealth management, and specialty financial services across multiple states.
Sales Growth
In general, banks make money from two primary sources. The first is net interest income, which is interest earned on loans, mortgages, and investments in securities minus interest paid out on deposits. The second source is non-interest income, which can come from bank account, credit card, wealth management, investing banking, and trading fees. Over the last five years, First Horizon grew its revenue at a tepid 2.8% compounded annual growth rate. This was below our standards and is a rough starting point for our analysis.
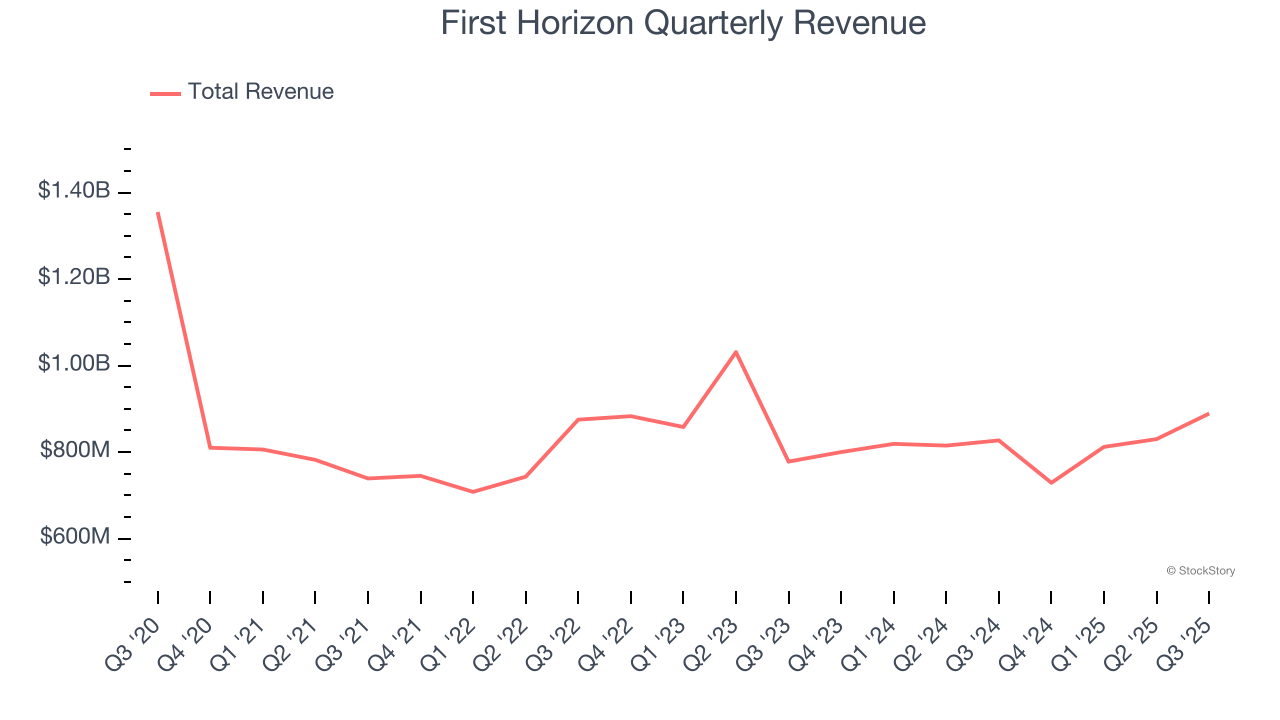
We at StockStory place the most emphasis on long-term growth, but within financials, a half-decade historical view may miss recent interest rate changes, market returns, and industry trends. First Horizon’s performance shows it grew in the past but relinquished its gains over the last two years, as its revenue fell by 4.2% annually. 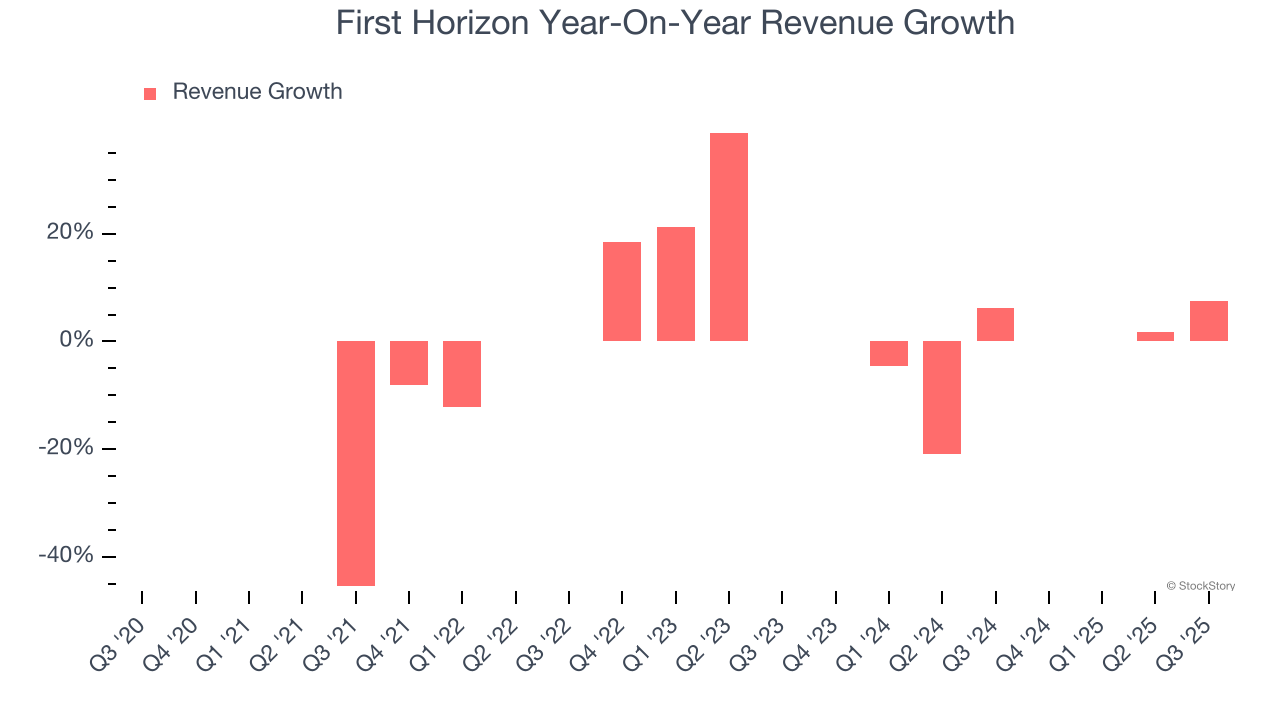 Note: Quarters not shown were determined to be outliers, impacted by outsized investment gains/losses that are not indicative of the recurring fundamentals of the business.
This quarter, First Horizon reported year-on-year revenue growth of 7.5%, and its $889 million of revenue exceeded Wall Street’s estimates by 5.6%.
Net interest income made up 73.2% of the company’s total revenue during the last five years, meaning lending operations are First Horizon’s largest source of revenue.
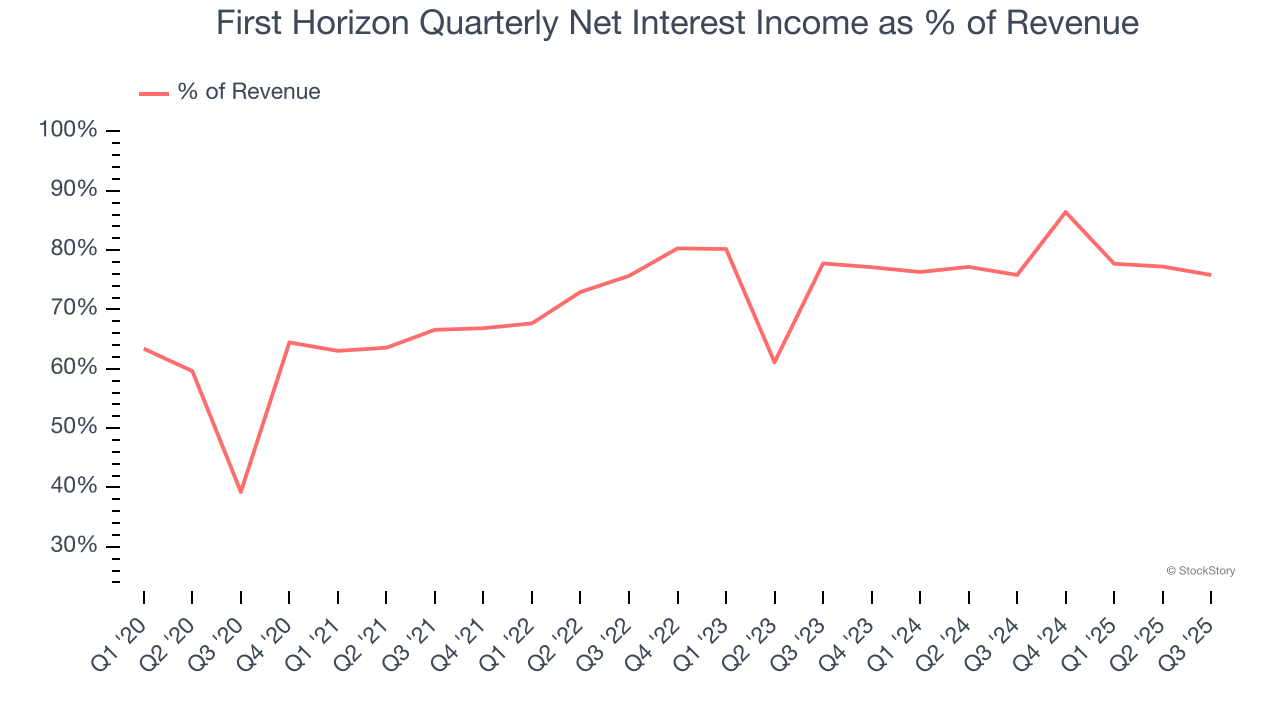
Our experience and research show the market cares primarily about a bank’s net interest income growth as non-interest income is considered a lower-quality and non-recurring revenue source.
Here at StockStory, we certainly understand the potential of thematic investing. Diverse winners from Microsoft (MSFT) to Alphabet (GOOG), Coca-Cola (KO) to Monster Beverage (MNST) could all have been identified as promising growth stories with a megatrend driving the growth. So, in that spirit, we’ve identified a relatively under-the-radar profitable growth stock benefiting from the rise of AI, available to you FREE via this link.
Tangible Book Value Per Share (TBVPS)
The balance sheet drives banking profitability since earnings flow from the spread between borrowing and lending rates. As such, valuations for these companies concentrate on capital strength and sustainable equity accumulation potential.
When analyzing banks, tangible book value per share (TBVPS) takes precedence over many other metrics. This measure isolates genuine per-share value by removing intangible assets of debatable liquidation worth. Other (and more commonly known) per-share metrics like EPS can sometimes be murky due to M&A or accounting rules allowing for loan losses to be spread out.
First Horizon’s TBVPS grew at an impressive 7% annual clip over the last five years. TBVPS growth has also accelerated recently, growing by 11.5% annually over the last two years from $11.22 to $13.94 per share.
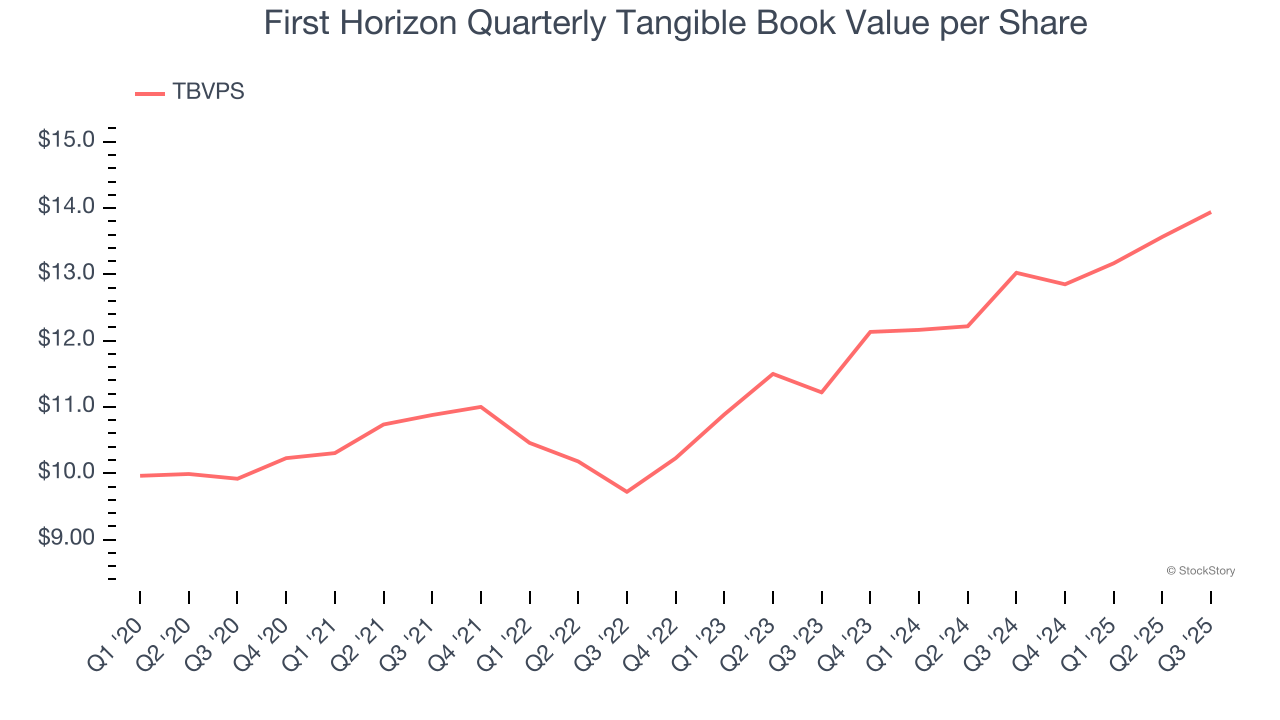
Over the next 12 months, Consensus estimates call for First Horizon’s TBVPS to grow by 5.7% to $14.73, mediocre growth rate.
Key Takeaways from First Horizon’s Q3 Results
We were impressed by how significantly First Horizon blew past analysts’ revenue expectations this quarter. We were also glad its EPS outperformed Wall Street’s estimates. Zooming out, we think this quarter featured some important positives. The stock traded up 5.2% to $24.19 immediately after reporting.
Indeed, First Horizon had a rock-solid quarterly earnings result, but is this stock a good investment here? If you’re making that decision, you should consider the bigger picture of valuation, business qualities, as well as the latest earnings. We cover that in our actionable full research report which you can read here, it’s free for active Edge members.